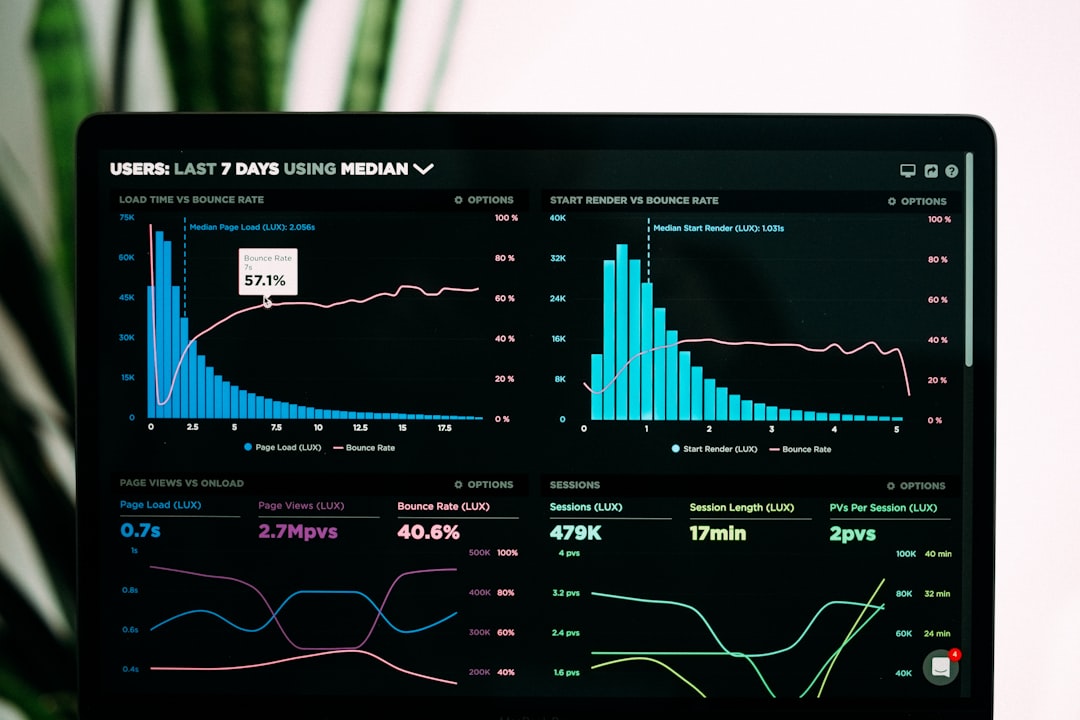
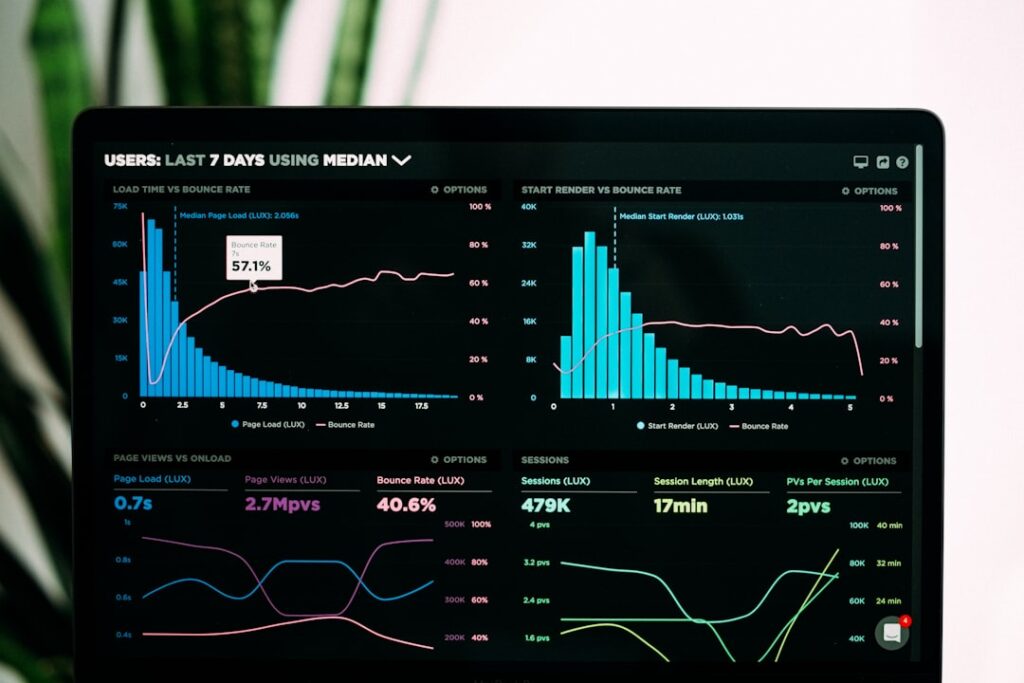
Open your productivity dashboard right now. Look at the task counter, the calendar widget, the time-tracking summary. Half of those numbers are stale. The other half update every few seconds. And unless you’ve dug into the documentation—or noticed a discrepancy the hard way—you probably don’t know which is which.
This matters more than it sounds. When you’re running a content business solo, you make decisions based on what the dashboard tells you: whether to write another post today, whether a client task is overdue, whether you’ve hit your revenue target. If the widget says “3 tasks remaining” but the real number is 7, you’re planning your afternoon around bad data.
How dashboards decide what’s live and what’s cached
Most productivity tools—project managers, time trackers, CRM dashboards—load two kinds of data when you open them. Real-time widgets poll the server every few seconds or hold open a WebSocket connection. Cached widgets load once when the page renders, then sit there until you manually refresh.
The split isn’t arbitrary. Real-time updates cost server resources. If a dashboard refreshed every widget every second for every user, the backend would collapse. So platforms choose: high-priority data gets live updates, and everything else gets cached.
Here’s what typically updates live:
- Notifications and activity feeds — new comments, mentions, task assignments
- Collaboration cursors — who’s viewing or editing the same doc
- Time-tracking widgets — current timer, today’s elapsed time
And what usually doesn’t:
- Task counts — “12 tasks due today” often requires a refresh to update
- Revenue or sales dashboards — payment processors batch webhook deliveries; your dashboard may lag 5–15 minutes
- Analytics summaries — “visitors this week” typically caches for an hour
- Calendar availability — syncs on load, not continuously
The problem: platforms don’t label which is which. A widget that looks like a live counter might be an hour old.
The tell: watch for the spinner
Most dashboards show a small loading spinner or skeleton state when a widget refreshes. If you sit on a page for five minutes and never see a spinner near a particular widget, it’s cached.
Try this: open your project dashboard in two browser windows side by side. In one, mark a task complete. Watch the other window. If the task count updates within 10 seconds, it’s live. If it doesn’t change until you reload, it’s cached.
Some platforms split the difference with polling intervals—the widget refreshes every 30 or 60 seconds, not continuously. That’s enough to feel current, but you can still catch it mid-drift if you check right after making a change elsewhere.
When cached data breaks your workflow
The worst-case scenario: you’re managing client work across multiple tools, and your aggregator dashboard pulls data from all of them. Each integration has its own refresh cadence. One updates every minute. Another updates every hour. A third only updates when you reload the page.
So you glance at the dashboard, see “2 tasks overdue,” and assume you’re on top of it. But one of those integrations hasn’t refreshed in 90 minutes. The real number is 5. You miss a deadline because the dashboard lied by omission.
This happens most often with:
- Zapier or Make.com dashboards showing “last run” timestamps—those update when the automation fires, not when you open the page
- Affiliate dashboards aggregating sales from multiple networks—each network posts webhooks on its own delay
- CRM deal pipelines pulling from email, calendar, and form submissions—email might be instant, but form data could batch every 15 minutes
The fix: know your refresh rules and build margin
First, check the docs. Most platforms document polling intervals somewhere, even if it’s buried in a FAQ. Search “[tool name] dashboard refresh rate” or “real-time updates.” If you find nothing, email support and ask directly.
Second, if a widget matters for time-sensitive decisions, always refresh manually before acting. Sounds tedious, but it takes two seconds and prevents the “I thought I was done” spiral.
Third, if you’re stitching together a custom dashboard—using Notion databases, Airtable, or a spreadsheet fed by API calls—set your own refresh intervals. Most no-code tools let you configure how often a data source re-polls. Default is often “on page load.” Change it to every 5 or 10 minutes if the data matters.
And fourth, don’t rely on a single dashboard for mission-critical numbers. If a client deadline depends on a task count, open the actual project tool and verify. Dashboards are for triage, not truth.
Want more breakdowns like this? Subscribe to One Two Three Send—we explain how online-business tools actually work, one feature at a time.