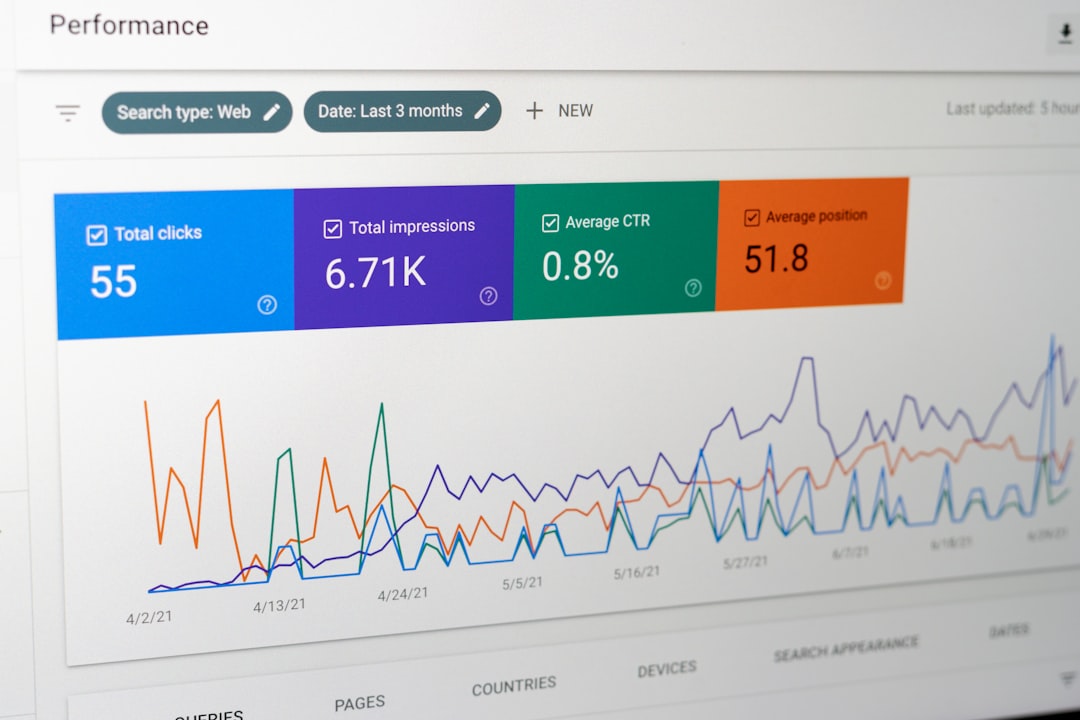
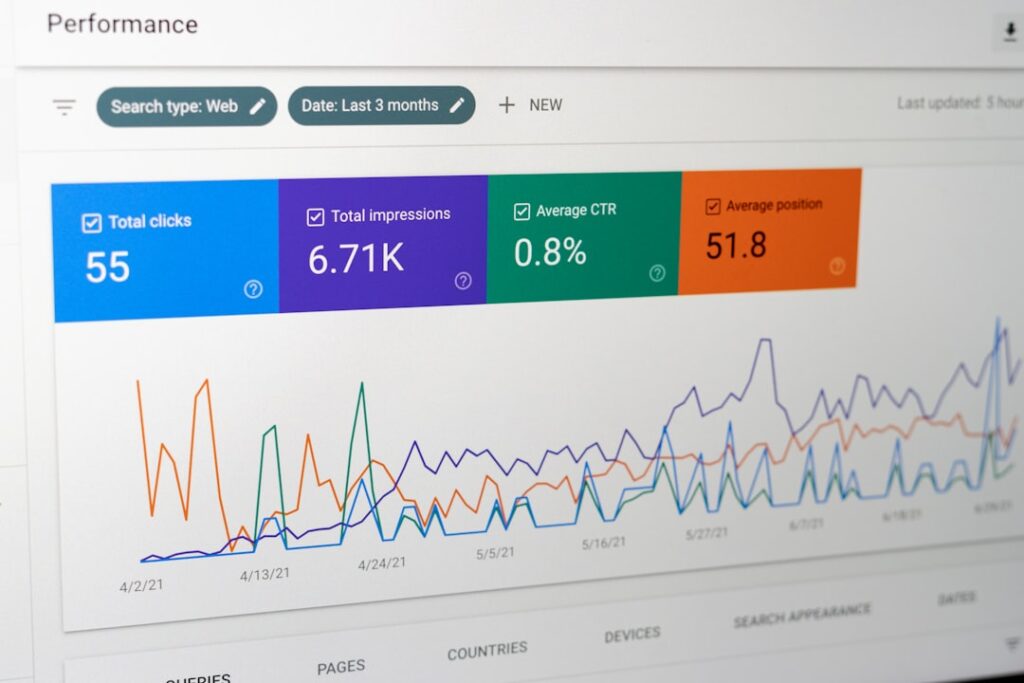
Google Search Console lets you filter queries, pages, countries, devices—then export the results as a CSV. What the interface doesn’t tell you: any export caps at 1,000 rows, even if your filtered view shows “12,483 rows available.”
If you run a content site with more than a few dozen published pieces, you’ve likely hit this ceiling without realizing it. The export completes without error. The file opens fine. You just never see row 1,001.
Where the cap appears
The 1,000-row limit applies to:
- Performance report exports (queries, pages, countries, devices, search appearance)
- Links report exports (top linking sites, top linking text)
- Any filtered view, whether you’ve applied one filter or ten
It does not apply to the API—more on that below.
The cap exists across date ranges. If you’re exporting six months of query data and 4,200 queries triggered impressions, you’ll get the top 1,000 by impressions, sorted descending. The rest disappear.
Why it matters for solo operators
Most online-business operators export Search Console data for:
- Finding low-hanging SEO opportunities (pages ranking 8–20 that could move up)
- Identifying keyword cannibalization (multiple URLs competing for the same query)
- Auditing underperforming content (impressions without clicks)
- Building editorial calendars around actual search demand
If your site has more than 1,000 indexed pages—or if you publish frequently enough that 1,000 queries have triggered impressions in the last 90 days—you’re analyzing an incomplete dataset every time you export.
The pages that fall outside the top 1,000 by impressions are often the ones worth investigating: older posts that still rank but underperform, or newly published pieces that haven’t accumulated enough impressions to crack the top of the list.
Three ways to pull complete data
1. Tighten your filters before exporting. Instead of exporting all queries, filter by page first. Export queries for one URL at a time. Each per-page export will stay well under 1,000 rows unless you’re running a major publication. Tedious, but it works without code.
2. Use the Search Console API. Google’s Search Console API returns up to 25,000 rows per request. You can script this in Python (the google-api-python-client library is well-documented), or use a no-code tool like Supmetrics or Coupler.io to pull data into Google Sheets. Expect to spend 30–60 minutes on initial setup if you’re not familiar with API authentication, but once it’s running, you can automate weekly or monthly pulls.
3. Use Google Sheets’ built-in Search Console connector. In Sheets, go to Data > Data connectors > Connect to Search Console (previously called “Search Console add-on”). It uses the API under the hood, so you bypass the 1,000-row cap. Free, no coding required. The interface is slower than a CSV export, and you’ll need to refresh manually, but for most solo operators, this is the sweet spot between effort and completeness.
What gets cut when you don’t notice
I pulled a recent 28-day Performance report for a 200-page content site. The browser interface showed 2,103 queries. The CSV export contained exactly 1,000.
The missing 1,103 queries had:
- 14,822 total impressions (roughly 11% of the site’s total for the period)
- 127 clicks
- An average position of 24.3
Those are queries where the site ranks on page 2 or 3—exactly the ones worth targeting for on-page optimization or internal linking. The export silently excluded them.
One non-obvious detail
When you export from a filtered view, Search Console sorts by the primary metric column (usually impressions) before applying the 1,000-row cap. If you’ve toggled the Performance chart to sort by clicks or position, the export still sorts by impressions. The UI doesn’t update to reflect this. If you want the top 1,000 queries by clicks, you’ll need to export, then re-sort in your spreadsheet—or use the API and specify orderBy: 'clicks' in your request.
If you’re running content acquisition strategies based on Search Console exports, audit your row counts. If you’re seeing exactly 1,000 rows in every export, you’re working with a sample, not the full picture.
Want more tooling breakdowns like this? Subscribe to One Two Three Send—one operator-focused article every day, no fluff.