Category: Monetisation

  • Course platform file upload limits and what happens at the boundary

    Course platform file upload limits and what happens at the boundary

    Course platform file upload limits and what happens at the boundary
    Photo: DS Pugh (CC BY-SA 2.0, via Wikimedia Commons)

    If you’ve ever uploaded a 2.1 GB course video to a platform with a 2 GB file limit, you know the frustration: some platforms reject it instantly, some let it upload for 45 minutes before failing, and some accept it but never process it.

    The boundary behavior—what happens when you hit or exceed a platform’s stated limit—varies wildly across course hosting tools. And because most operators don’t test edge cases until launch week, these differences cost time, bandwidth, and occasionally subscriber trust.

    Here’s what actually happens when you push the limits on three major platforms, and how to plan around their quirks.

    Teachable: hard stop at upload start

    Teachable enforces a 3 GB per-file limit for video uploads on all plans. If your file is 3.01 GB, the upload dialog won’t start. You’ll see an error message immediately: “File exceeds maximum size.”

    This is the cleanest failure mode. You know right away, before burning bandwidth or time. The downside: Teachable doesn’t compress or transcode client-side, so if your raw export is 3.2 GB, you need to re-encode it before upload. There’s no “let the platform handle it” option.

    Workaround: use Handbrake or similar to target H.264 at a slightly lower bitrate. For most 1080p talking-head content, 4 Mbps video gets you under 2.5 GB for a 90-minute lesson without visible quality loss.

    Kajabi: accepts upload, fails silently during processing

    Kajabi’s stated limit is 5 GB per file, but the real ceiling depends on your plan and whether you’re uploading via browser or the bulk uploader. On the Basic plan, files over 4 GB often upload successfully—progress bar completes—but then sit in “Processing” indefinitely.

    No error email. No dashboard alert. The file just never becomes available to students. If you don’t manually check back 12 hours later, you won’t know it failed.

    This is the worst failure mode for operators. You’ve burned upload time, you think the content is live, and students see a blank lesson or a spinner.

    Workaround: keep files under 3.5 GB even if your plan technically allows 5 GB. And always check the “Processed” timestamp in the library view before publishing a course.

    Thinkific: queues large files, then downgrades quality

    Thinkific’s limit is officially 5 GB, but files over 2 GB enter a slower processing queue. Upload completes normally, but transcoding can take 6–24 hours depending on platform load. During that window, students see a “Video is processing” message.

    Once processed, Thinkific applies adaptive bitrate streaming. But if your source file is large and high-bitrate, the platform may serve a lower-quality version to students on slower connections—even if you uploaded 1080p.

    This isn’t a failure, but it’s a surprise. Your 4K export might stream at 720p for 40% of viewers.

    Workaround: upload a clean 1080p H.264 file at 5–8 Mbps. That’s high enough for quality, low enough that Thinkific won’t aggressively downgrade. And schedule uploads at least 48 hours before launch.

    What about Vimeo or Wistia embeds?

    If you host video externally and embed it in your course platform, you bypass the platform’s file limits entirely. Vimeo Pro allows 20 GB per file; Wistia has no hard cap but recommends under 8 GB for optimal processing.

    The trade-off: you’re now managing two dashboards, two sets of analytics, and two potential points of failure. And some course platforms (Teachable included) don’t pass completion tracking reliably when you use third-party embeds. Students can watch the full video but the lesson won’t mark complete.

    This works well for operators who already have a Vimeo or Wistia account for other content, but it’s not a universal fix.

    One non-obvious tip: test with a disposable file first

    Before uploading your final course content, create a test file at exactly your platform’s stated limit plus 10%. Use a screen recording tool or export a low-content video at high bitrate to hit the target size.

    Upload it to a draft course. Wait 24 hours. Check if it processed, if quality degraded, if it triggered any backend errors.

    This takes 20 minutes and saves you from discovering boundary behavior during a launch.

    If you’re building a course business and want more operator-level breakdowns like this, subscribe to One Two Three Send—we cover the tooling details other newsletters skip.


  • Beehiiv ad network approval: what editors review and how long it takes

    Beehiiv ad network approval: what editors review and how long it takes

    Beehiiv ad network approval: what editors review and how long it takes
    Photo by Markus Winkler on Unsplash

    Beehiiv‘s Ad Network promises to connect newsletter operators with premium sponsors without the cold-outreach grind. But between clicking “Apply” and seeing your first ad impression, there’s a review process that isn’t clearly documented anywhere in the dashboard.

    If you’re planning to monetise through the network, here’s what actually happens during approval—and what slows it down.

    What the review team checks

    Beehiiv‘s Ad Network approval isn’t automated. A human editor reviews three things:

    • Subscriber count and engagement. The official threshold is 2,500 subscribers, but approval rates climb significantly above 5,000. More importantly, they check recent open rates. If your last five sends averaged below 30%, expect a rejection or a request to reapply later.
    • Content consistency. They’re looking for a defined niche and a regular publishing cadence. If your archive shows three posts in January and then nothing until August, that’s a red flag. Brands want predictable inventory.
    • Brand safety. The editor skims your last 10–15 issues for anything that might spook advertisers: excessive profanity, polarising political content, or anything that violates Beehiiv’s acceptable-use policy. This isn’t about ideology—it’s about whether a SaaS company will feel comfortable placing a banner next to your prose.

    One non-obvious detail: they also check whether you’re already running direct sponsorships. If you are, that’s actually a positive signal. It shows you understand ad placement and have an audience advertisers value.

    The actual timeline

    Beehiiv’s help docs say “up to five business days.” In practice, most approvals land within 48–72 hours. Rejections come faster—often within 24 hours.

    But here’s where it gets slow: if your application is borderline, it gets escalated to a second reviewer. That adds another three to five days. And if you’re flagged for manual subscriber verification (usually because your list grew unusually fast or your domain is very new), expect a week or more.

    If you haven’t heard back in seven business days, reply to your original application email. Don’t open a new support ticket—that resets the queue.

    What happens after approval

    Approval doesn’t mean ads start immediately. You’re added to the network’s inventory pool, and advertisers choose placements based on audience fit, niche, and available budget.

    For newsletters under 10,000 subscribers, it’s common to wait two to four weeks before your first ad runs. Larger lists (25,000+) typically see their first placement within a week.

    Once you’re live, Beehiiv’s system automatically inserts ads into your sends based on the placement settings you choose: top, middle, or bottom. You set a frequency cap (e.g., one ad per issue), and the network fills it when a match is available. If no advertiser is queued, the slot stays empty—your issue goes out ad-free.

    Revenue is CPM-based, and Beehiiv takes a 25% platform fee. Rates vary widely by niche, but most operators report $8–$15 CPM after the split. Payments are net-60, processed through Stripe.

    When to apply—and when to wait

    If you’re sitting at 2,600 subscribers with a 28% open rate and inconsistent publishing, wait. You’ll likely get rejected, and reapplying within 90 days rarely changes the outcome unless your metrics improve significantly.

    Better to hit 5,000 subscribers, lock in a weekly cadence for two months, and then apply. Your approval odds jump, and you’ll have enough volume to make the CPM model worthwhile.

    If you’re already running direct sponsorships at $300–$500 per placement, do the math before switching. The Ad Network is lower-friction, but direct deals almost always pay better for lists above 10,000 subscribers.

    Want more breakdowns like this? Subscribe to One Two Three Send for weekly deep-dives on the tools and tactics that power online businesses.

    Heads up — some links in this article are affiliate links. If you sign up through them, we may earn a small commission at no extra cost to you. We only recommend tools we use ourselves.

  • Most operators run two payment processors—here’s when to drop one

    Most operators run two payment processors—here’s when to drop one

    Most operators run two payment processors—here's when to drop one
    Photo by Ali Mkumbwa on Unsplash

    Walk through the back end of most solo-operated businesses and you’ll find at least two payment processors wired up: Stripe for subscriptions and one-clicks, PayPal for the holdouts who won’t touch a credit card form, maybe a third regional option if you serve international customers hard.

    The logic makes sense on paper. More payment options theoretically means fewer abandoned carts. But dual processor setups introduce reconciliation overhead, split your transaction history across dashboards, and double your compliance surface area. For a lot of operators, the second processor is dead weight.

    Here’s how to figure out whether you actually need both—and what the math looks like when you don’t.

    What dual processors actually cost you

    The direct fees are visible: Stripe charges 2.9% + $0.30 per transaction in the U.S., PayPal runs similar rates but adds a fixed fee for certain cross-border transactions. If your average order is $47 and you process 120 transactions a month across both platforms, the percentage fees are roughly equivalent.

    The hidden cost is operational. You’re logging into two dashboards to pull reports. Your accounting workflow imports two CSVs. Refunds, disputes, and chargebacks follow different processes. If you’re running a subscription model, you’re managing two sets of dunning logic, two retry schedules, two places where a customer’s card can fail.

    One operator I spoke with last month was processing $11,400 monthly revenue—78% through Stripe, 22% through PayPal. She spent 90 minutes each month reconciling the two, manually matching PayPal transactions to her CRM because her automation tool couldn’t reliably handle both feeds. At $150/hour effective rate, that’s $225/month in reconciliation labor to preserve $2,508 in PayPal revenue. The margin was there, but barely.

    When two processors make sense

    There are clear cases where parallel processors pay off:

    • Geographic coverage gaps. If you serve customers in regions where Stripe doesn’t operate or where PayPal has significantly better local currency support, the second processor isn’t optional—it’s infrastructure.
    • Customer concentration risk. If one processor represents 95% of your revenue and that account gets frozen during a routine compliance review, you’re dead in the water. A second processor acts as insurance, especially if you’re in a higher-risk category like digital downloads, consulting, or anything with delayed delivery.
    • Measurably different conversion rates. Some audiences simply won’t convert without PayPal. If A/B tests show that offering PayPal increases completed checkouts by 12% or more, and your average customer value justifies the added complexity, keep both.

    But most operators I’ve reviewed don’t fit these profiles. They added PayPal three years ago because a handful of customers asked for it, and it’s been running on autopilot ever since.

    How to audit your processor split

    Pull the last 90 days of transaction data from both platforms. You’re looking for three numbers:

    Volume distribution. What percentage of transactions flow through each processor? If one handles less than 10% of total volume, you’re maintaining an entire integration for edge cases.

    Revenue per transaction. Calculate average order value by processor. If your PayPal transactions average $23 and your Stripe transactions average $68, you’re using PayPal for low-value impulse buyers and Stripe for your core customers. That’s fine if the volume justifies it, but if those $23 orders represent 6% of monthly revenue, you’re over-indexed on supporting them.

    Dispute and refund rates. Pull your chargeback and refund rates by processor. If one consistently runs 3x the dispute rate of the other, you’re absorbing higher operational friction and potentially higher fees for that segment.

    One operator dropped PayPal after discovering that 91% of their PayPal transactions were under $15, with a 9% refund rate compared to 2% on Stripe. The hassle of managing two systems wasn’t worth the $340/month in low-margin revenue.

    What happens when you consolidate

    Expect some falloff. When you remove a payment option, a small percentage of customers won’t convert. Industry benchmarks suggest 5–8% of buyers abandon checkout when their preferred payment method disappears.

    But that’s gross abandonment, not net revenue loss. Many of those buyers come back and pay with the remaining option. Others were bottom-of-funnel browsers who weren’t going to convert anyway. The actual revenue loss tends to be 2–4% in the first month, then levels off.

    The flip side: your reconciliation time drops to near zero, your dunning logic runs on one system, and your accounting close gets 40% faster. For most operators, that trade makes sense once one processor dips below 15% of total revenue.

    If you’re still on the fence, try this: turn off the secondary processor for two weeks and measure what happens. Route 100% of traffic through your primary processor, track conversion rate and completed transactions daily, and see whether the drop is material. If you lose less than the cost of managing two systems, make the cut permanent.

    One last thing: if you found this useful, you’ll want the next one. Subscribe to One Two Three Send and get operator-focused breakdowns like this in your inbox twice a week.

  • Affiliate link cloaking: what happens when platforms change redirect rules

    Affiliate link cloaking: what happens when platforms change redirect rules

    Affiliate link cloaking: what happens when platforms change redirect rules
    Photo: Fuzheado via Wikimedia Commons (CC0)

    Affiliate link cloaking—redirecting yoursite.com/recommends/tool to partner.com/?ref=yourID—works until it doesn’t. And when it stops, you often won’t know until commissions disappear.

    Platform redirect policy changes happen quietly. Amazon updated theirs in early 2025, requiring tag= parameters to appear in the original click, not after a 301. Pinterest changed how it crawls redirects in late 2024, treating multi-hop chains as suspicious. TikTok’s in-app browser now strips certain query parameters on the second redirect.

    Most affiliate dashboards don’t tell you why a click didn’t convert. They show impressions, clicks, and sales—but the gap between click and sale stays opaque. If your cloaked link triggers a policy violation, the click registers, the redirect happens, but the attribution dies.

    What redirect chains actually look like

    A typical cloaked affiliate link creates at least two hops:

    • Hop 1: Reader clicks yoursite.com/recommends/tool
    • Hop 2: Your server issues a 301 or 302 to partner.com/?ref=yourID
    • Hop 3 (sometimes): Partner platform redirects again to the actual product page

    Each hop adds latency—30 to 150 milliseconds depending on server location and DNS lookup. More importantly, each hop is a point where attribution can break. If the affiliate network expects the referrer header to match your domain, but a browser extension or VPN strips it mid-chain, the sale won’t attribute.

    Link management plugins like Pretty Links, ThirstyAffiliates, and Lasso handle the redirect, but they can’t control what happens after the hand-off. If Amazon decides your redirect pattern looks like a masked URL shortener, it won’t tell your plugin—it just stops crediting conversions.

    When platforms change the rules

    Three recent examples that broke established cloaking setups:

    Amazon Associates began enforcing stricter referrer validation in Q1 2025. Links that redirect through a non-whitelisted domain now require the associate tag in the first URL, not the final destination. If your cloak is yoursite.com/amazon/product and it redirects to amazon.com/dp/B08XYZ?tag=yourID, Amazon may not credit it unless tag=yourID appears in the cloaked URL itself—which defeats the purpose of cloaking.

    Impact Radius and ShareASale both tightened multi-hop detection in 2024. Links that pass through more than two redirects before landing on the merchant site trigger fraud flags. If you’re using a link shortener and a cloak and the merchant uses its own redirect layer, you’ve hit three hops—and the click may not count.

    Social platform in-app browsers are the silent killer. TikTok, Instagram, and LinkedIn all use custom WebView browsers that strip or modify query parameters unpredictably. A cloaked link that works fine in Chrome may lose its affiliate ID when opened inside the TikTok app. You won’t see an error—the link just opens without attribution.

    What to monitor and when to adapt

    Most operators only notice redirect problems when monthly commissions drop without a corresponding traffic dip. By then, you’ve lost weeks of sales.

    Set up a monthly check:

    • Compare click-through rate to conversion rate in your affiliate dashboard. If CTR holds steady but conversions drop 20%+, suspect redirect breakage.
    • Test your cloaked links in incognito mode across browsers and devices. Open them in the TikTok app, Instagram in-app browser, and LinkedIn mobile. Check the final URL in the address bar—does your affiliate ID survive?
    • Run a redirect chain audit using a tool like Redirect Path (browser extension) or the command-line tool curl -I. Count the hops. Three or more is a red flag.

    If you discover a broken chain, you have two options: simplify the redirect or switch to direct affiliate links with branded slugs (e.g., yoursite.com/go/tool that’s visible but still trackable). Some operators now use branded short domains—recs.yourname.com/tool—to keep links clean without full cloaking.

    One more thing: if you’re driving significant affiliate revenue—over $2,000/month from a single program—ask your affiliate manager if your redirect setup is compliant. Most will tell you. Some will whitelist your domain to bypass restrictive filters. It’s worth the email.

    Got a redirect mystery or a link setup that stopped working? Reply to this email—I’ll dig into it for a future piece.

  • Patreon vs. Ko-fi vs. Buy Me a Coffee: who gets paid faster

    Patreon vs. Ko-fi vs. Buy Me a Coffee: who gets paid faster

    Patreon vs. Ko-fi vs. Buy Me a Coffee: who gets paid faster
    Photo: American Truth Project via Wikimedia Commons (Public domain)

    If you’re running a content business on fan contributions, the three weeks between earning $500 and having it in your bank account can be the difference between making payroll and missing it.

    Patreon, Ko-fi, and Buy Me a Coffee all let audiences send you money, but their payout schedules, fee structures, and hold policies differ enough that choosing the wrong one can cost you hundreds of dollars in delay or processing costs every month.

    Here’s how each platform actually works when it comes to getting your money.

    Patreon: monthly batching with a five-day hold

    Patreon batches member payments on the first of every month (or on your custom billing date if you’re on their legacy per-creation model). Once those payments clear, Patreon holds the funds for five business days before initiating a payout to your bank account.

    That means if you earn $1,200 from 40 patrons on October 1, you’ll see the money in your account around October 8–10, depending on your bank’s processing time.

    Patreon takes 5% to 12% depending on your plan tier (Lite, Pro, or Premium), plus payment processing fees of roughly 2.9% + $0.30 per transaction. If you’re on the Lite plan at 5%, you’re netting about $1,026 from that $1,200—assuming all payments succeed.

    Failed payments get retried automatically for up to a week, but if a patron’s card declines and doesn’t recover, you don’t get paid for that month. Patreon doesn’t front you the money.

    Ko-fi: instant payout option, but only on Premium

    Ko-fi offers two modes: free and Premium ($108/year as of September 2026).

    On the free plan, Ko-fi holds payments for up to 30 days before releasing them to your PayPal or Stripe account. That’s a full billing cycle—longer than Patreon.

    On the Premium plan, you unlock instant payouts. Supporters’ payments land in your connected Stripe or PayPal account within minutes, and you control when to transfer that balance to your bank. For most operators, that’s a 2-day ACH transfer via Stripe or a same-day PayPal withdraw (for a 1.5% fee).

    Ko-fi takes 0% platform fee on Premium. You pay only Stripe or PayPal’s standard processing fees: roughly 2.9% + $0.30 per transaction. That same $1,200 month nets you about $1,161 after processing, assuming 40 × $30 one-time tips.

    The catch: if you’re using Ko-fi’s monthly membership feature (their Patreon alternative), payouts are still monthly, not instant—even on Premium.

    Buy Me a Coffee: weekly or monthly, depending on volume

    Buy Me a Coffee operates on a hybrid schedule. Small accounts (under $1,000/month) get paid monthly, around the 10th of the following month. Larger accounts graduate to weekly payouts once you cross that threshold consistently.

    There’s no platform fee—Buy Me a Coffee takes 5% only on tips sent through their iOS or Android apps (to cover Apple/Google’s 30% cut). Web-based tips are fee-free aside from payment processing at 2.9% + $0.30.

    If you earn $1,200 in September via the web, you’ll receive roughly $1,161 around October 10. If you’ve crossed into weekly payouts, you’d get four transfers of ~$290 each, landing every Friday.

    One quirk: Buy Me a Coffee holds payouts for 7 days on your first three transactions as a new account, regardless of volume. After that, the monthly or weekly schedule kicks in.

    Which one to pick

    If you need cash flow predictability and can absorb a five-day delay, Patreon works well for membership models with recurring monthly supporters. The fee structure is higher, but the audience expects to support creators there, and discovery features can drive new patrons.

    If you want instant access to funds and you’re okay paying $108/year, Ko-fi Premium is the fastest route—especially for one-time tips or project-based funding. Monthly memberships still batch, though.

    If you’re just starting out or you don’t want to pay an annual fee, Buy Me a Coffee splits the difference. You’ll wait longer initially, but once you hit weekly payouts, you’re getting money almost as fast as Ko-fi without the subscription cost.

    All three platforms work. The one that fits depends on whether you value speed, cost, or audience expectations more. If you’re choosing between them, model out your monthly volume, multiply by each platform’s effective fee rate, and map your cash flow needs against their payout schedules. The right answer shows itself in a spreadsheet.

    Which platform do you use, and has payout timing ever caused you a problem? Hit reply—I’d like to hear whether operators are switching platforms for cash flow reasons or sticking with what their audience already knows.

  • Payment processor reserved balances: when Stripe holds 20% of revenue

    Payment processor reserved balances: when Stripe holds 20% of revenue

    Payment processor reserved balances: when Stripe holds 20% of revenue
    Photo by Towfiqu barbhuiya on Unsplash

    You wake up to find $4,800 of this month’s course sales sitting in a “reserved balance” instead of your bank account. Stripe didn’t warn you. The dashboard shows the money as “pending” with a 30-day hold. Your rent is due in six days.

    Payment processor reserves aren’t rare. They’re automatic risk controls that lock a percentage of your revenue when transaction patterns change. For solo operators running subscription businesses, they can freeze 10–30% of incoming payments for weeks—sometimes longer.

    How reserves work and when they trigger

    Stripe, PayPal, and most payment processors use rolling reserves or fixed-percentage holds to cover potential chargebacks and refunds. The system monitors your account for pattern changes: a sudden revenue spike, a new product launch, a shift from one-time to recurring billing, or an uptick in dispute rates.

    When a reserve triggers, the processor withholds a percentage of each transaction. That money sits in a segregated balance. After a set period—typically 30 to 90 days—the funds release on a rolling basis. If you process $10,000 in Week 1 with a 20% reserve, you’ll receive $8,000 immediately. The remaining $2,000 releases 30 days later, assuming no disputes.

    Reserves don’t require your approval. They’re written into the merchant agreement. Stripe’s terms allow them to impose or adjust reserves at any time based on “risk assessment.” PayPal’s policy is nearly identical.

    Common triggers include:

    • Revenue increasing 200% or more month-over-month
    • Launching a high-ticket product (above $500) for the first time
    • Switching from physical goods to digital products or services
    • Chargeback rates exceeding 0.5% of transaction volume
    • Customer complaints or refund requests spiking above historical norms

    What percentage gets held and for how long

    Standard rolling reserves range from 10% to 30% of transaction volume, held for 30 to 120 days. Stripe’s default is 20% for 90 days when risk signals appear. PayPal’s can go as high as 30% for 180 days if your account is flagged for elevated dispute activity.

    Fixed reserves are rarer but more severe. Instead of a percentage, the processor holds a flat dollar amount—say, $15,000—until they determine risk has subsided. This typically happens after multiple chargebacks on high-value transactions or if your business model changes dramatically (e.g., pivoting from consulting to software subscriptions).

    Reserves aren’t interest-bearing. You don’t earn anything while the money sits. If your effective cost of capital is 8% annually, a $10,000 reserve held for 90 days costs you roughly $200 in opportunity cost—not counting cash-flow disruption.

    How to check if a reserve is active

    In Stripe, go to Balance → Overview. If a reserve is active, you’ll see a “Reserved funds” line with the held amount and release schedule. Click through for transaction-level detail showing which payments are affected.

    PayPal buries it deeper: log in to Business Account → Reports → Reserved Funds. The interface shows pending releases by date, but won’t always explain why the reserve was imposed. You’ll need to contact support for specifics.

    If you’re using Stripe Connect to process payments on behalf of sellers (e.g., a marketplace or platform business), reserves can cascade. Stripe may hold funds at the platform level and at the connected-account level, compounding cash-flow strain.

    What you can do when a reserve hits

    Contact processor support immediately. Explain your business model, provide transaction history, and ask for reserve terms in writing. If you can demonstrate stable operations—low refund rates, no dispute history, predictable revenue—you may negotiate a lower percentage or shorter hold period.

    Provide documentation: churn reports, customer testimonials, refund policies, delivery confirmations. Processors care about risk mitigation. Evidence that you run a clean operation can reduce or lift a reserve within 5–10 business days.

    If you’re launching a new offer or expect a revenue spike, email your processor before it happens. Proactive communication rarely prevents reserves, but it establishes context. When the algorithm flags your account, a support agent reviewing the case will see your heads-up and may approve a lighter hold.

    Diversify payment rails. Run Stripe for subscriptions and PayPal for one-time course sales, or vice versa. If one processor imposes a reserve, the other remains unaffected. This doesn’t eliminate risk, but it reduces single-point-of-failure exposure.

    Track reserve release schedules in your cash-flow forecast. Don’t budget reserved funds as liquid. They’re not available until the hold expires. If you’re running tight margins, a 20% reserve on $50,000 monthly revenue means planning around $40,000 actual receipts.

    One non-obvious detail: Reserves don’t automatically lift when the hold period ends. Stripe and PayPal release funds on a rolling basis, but the reserve itself may stay active indefinitely if risk signals persist. You might receive October’s held funds in December, but November’s transactions are still subject to the same 20% hold. Always confirm whether the reserve is temporary or ongoing.

    If cash flow is critical and a reserve would sink your operations, consider underwriting your own risk. Set aside 15–20% of monthly revenue in a separate account as a self-imposed buffer. It’s not ideal, but it beats scrambling when a processor locks your funds without warning.

    Running into payment processor issues? Reply and tell me what happened—I’ll cover operator-reported problems in a future piece.

  • Productized service waitlists: when limited spots sell better than open carts

    Productized service waitlists: when limited spots sell better than open carts

    Productized service waitlists: when limited spots sell better than open carts
    Photo by Edoardo Cuoghi on Unsplash

    Most solo operators running productized services—coaching packages, content audits, technical reviews—leave their cart open all year. The pitch is simple: anyone can buy anytime. But operators who close enrollment and run waitlists report higher conversion rates, better client fit, and fewer refund requests.

    The psychology isn’t complicated. Scarcity works. But the mechanics matter more than the marketing angle. A waitlist isn’t just a landing page with a countdown timer—it’s a commitment device that changes how you deliver and who you attract.

    Why waitlists work operationally, not just psychologically

    The obvious benefit is urgency. When spots are limited and the next cohort opens in six weeks, buyers make faster decisions. But the real advantage shows up in delivery.

    If you sell a service with any back-and-forth component—calls, feedback rounds, async review cycles—batching clients by cohort smooths your workload. Instead of onboarding one person Monday, two on Thursday, and three the following week, you onboard twelve people the same day. You record one welcome video. You send one kickoff email. You run one group orientation call if the format supports it.

    Even if your service is fully one-to-one, batching intake means you’re not context-switching between discovery calls, active client work, and offboarding every single day. You spend two weeks selling, four weeks delivering, then two weeks improving your materials before the next round.

    This isn’t theoretical. Operators running quarterly cohorts report 20–30% more throughput than those with rolling enrollment, even when total revenue stays flat, because less time goes to administrative overhead.

    When to use a waitlist vs. open cart

    Waitlists work best when your service has one or more of these traits:

    • High touch. If you’re on calls, reviewing work, or providing detailed feedback, batching clients prevents burnout.
    • Seasonal demand. Tax prep, course launch support, year-end strategy—services tied to calendar events naturally suit closed enrollment.
    • Capacity caps. If you can only serve eight clients per quarter without quality dropping, a waitlist enforces that limit before you overcommit.
    • Improving materials. Closing the cart gives you time to update templates, refine your process, or add new deliverables without live clients expecting the old version.

    Open carts work better for low-touch, async, or evergreen products. If someone buys a Notion template, a recorded workshop, or a one-time audit with a two-week turnaround, there’s no operational reason to make them wait.

    How to structure the waitlist without killing momentum

    The failure mode of waitlists is letting interest go cold. Someone signs up in July, you email them in October, and they’ve moved on or forgotten why they cared.

    Successful operators send at least one interim email between signup and cart open. Not a sales pitch—a case study, a free template, or a behind-the-scenes update on what’s changing in the next cohort. The goal is to remind them you exist and prove you’re still improving the offer.

    Pricing also shifts. Operators who run waitlists often raise prices 10–20% compared to what they’d charge with open enrollment, because the exclusivity justifies it and the operational efficiency supports higher per-client value. If you’re spending less time on admin, you can afford to spend more time per engagement.

    One more structural detail: most high-converting waitlists offer early access to the waitlist itself. If general cart-open is Monday at noon, waitlist subscribers get a link Sunday night. That 12-hour window captures the highest-intent buyers and creates a second layer of exclusivity.

    What to track when you switch

    If you’re moving from open cart to cohort-based waitlist, track these four metrics over two cycles:

    • Waitlist-to-purchase conversion rate. Industry average is 15–25% for productized services. If you’re below 10%, your messaging or offer needs work.
    • Time from signup to open. Longer than eight weeks and you’ll lose half your list to attention decay.
    • Client start-to-finish time. Batching should compress this. If it doesn’t, you’re not actually delivering cohort-style.
    • Refund and satisfaction rates. Waitlists attract higher-intent buyers. If refunds don’t drop, the scarcity is cosmetic, not operational.

    The operators who make this work treat the waitlist as a forcing function, not a marketing tactic. It’s not about pretending you’re sold out—it’s about actually limiting capacity so you can deliver better work, faster, without burning out by Thursday.

    If you’re running a productized service and your calendar feels chaotic, try closing enrollment for one quarter. You’ll know in 90 days whether batching improves delivery or just annoyed buyers who wanted instant access.

  • Stripe connect onboarding: when split-payment setup blocks sellers

    If you’re building a marketplace, course platform with affiliate payouts, or any business that splits revenue between multiple parties, you’ve probably implemented Stripe Connect. And if you’ve watched sellers or partners try to onboard, you’ve seen how often they get stuck.

    The problem isn’t Stripe’s reliability—it’s that Connect has two completely different onboarding paths, and choosing the wrong one for your use case creates friction you can’t fix from your dashboard.

    Custom vs. Express: the split that matters

    Stripe Connect offers two main account types: Custom and Express. Custom accounts let you control the entire onboarding UI and branding, but you inherit full responsibility for collecting tax forms, verifying identity documents, and handling compliance. Express accounts hand that work to Stripe—your sellers see Stripe-branded onboarding, and Stripe manages verification.

    Most solo operators and small teams pick Express because it’s faster to implement. You redirect the seller to a Stripe-hosted form, they fill it out, and Stripe emails them when something’s missing. That works—until it doesn’t.

    The bottleneck shows up when a seller enters information that triggers manual review. Stripe’s automated checks flag certain patterns: mismatched business addresses, high-risk industry codes, or account details that don’t align with public records. When that happens, the seller sees a vague “under review” message, and you see nothing in your Connect dashboard except a pending status.

    Express accounts route all communication through Stripe’s support system, not yours. The seller waits for an email. You wait for the seller to resolve it. If they don’t check spam or if Stripe requests a document they don’t have on hand, onboarding stalls indefinitely. You can’t intervene, because you don’t own the relationship during verification.

    When Custom accounts make sense

    Custom accounts flip the script. You collect every data point yourself—legal business name, tax ID, bank details, beneficial ownership—and send it to Stripe via API. Stripe still runs the same fraud and compliance checks, but all communication routes through your platform.

    That means when a seller’s information gets flagged, you receive the webhook. You decide how to surface the error, what language to use, and whether to let them retry or escalate to support. You control the timeline.

    The tradeoff: you’re building the entire onboarding form. That includes file upload flows for identity documents, logic to handle different entity types (sole proprietor vs. LLC vs. corporation), and state management for multi-step verification. Stripe provides client libraries and examples, but you’re writing and maintaining the UI.

    For a solo operator launching a small marketplace, that’s often overkill. But if your sellers are high-value—coaches charging $2,000 per course sale, affiliates earning four-figure monthly commissions—the ability to unblock them yourself justifies the build time.

    The fields that fail most often

    Three data points cause the majority of Connect onboarding blocks:

    Business address mismatch. If a seller registers as a business entity but enters a residential address that doesn’t match their state’s business registry, Stripe flags it. This happens constantly with sole proprietors using their home address. The fix: let sellers clarify “doing business as” vs. registered entity name before they hit submit, or prompt them to choose “individual” instead of “company” as their account type.

    Bank account ownership. Stripe verifies that the bank account name matches the Connect account’s legal name. If someone registers their business as “Jane Doe Consulting LLC” but links a personal checking account under “Jane Doe,” verification fails. You can’t override this. The seller has to update their bank account or re-register the Connect account with a matching name.

    Missing beneficial ownership data. For any business entity, Stripe requires details on anyone who owns 25% or more of the company. If your onboarding form doesn’t explicitly ask for this upfront, the seller submits, gets approved provisionally, then hits a block weeks later when Stripe’s compliance review catches up. Custom accounts let you enforce this field before submission; Express accounts surface it late.

    What you can do today

    If you’re already using Express accounts and onboarding is slow, audit your redirects. Stripe’s account_onboarding link expires after the seller completes it once. If they need to update information later, you have to generate a fresh link and send it manually. Automate that: listen for account.updated webhooks with requirements.currently_due populated, and email a new onboarding link immediately.

    If you’re starting fresh or rebuilding, evaluate whether your sellers justify Custom accounts. A course platform with 12 high-ticket instructors? Build Custom. A marketplace with 300 low-margin sellers? Stick with Express and accept that 10–15% will get stuck in verification.

    Either way, monitor your capabilities status in the Stripe API. Every Connect account has a transfers capability that can be active, pending, or inactive. If it’s pending for more than 48 hours, surface that in your seller dashboard with specific next steps, not just “contact support.”

    Running a paid newsletter, course, or membership with complex payouts? Reply with your current setup—I’ll cover payout scheduling and transfer timing in an upcoming piece.

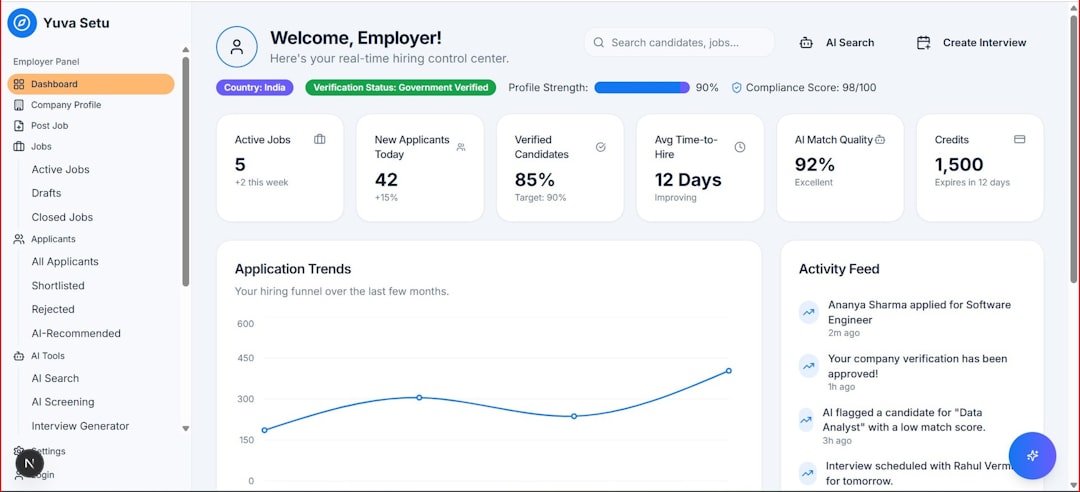
  • Monetisation dashboards skip your highest-value conversions

    Monetisation dashboards skip your highest-value conversions

    Monetisation dashboards skip your highest-value conversions
    Photo by Carlos Muza on Unsplash

    Open your Stripe dashboard, your Gumroad analytics, or your membership platform’s revenue chart. You’ll see clean bars: daily sales, monthly recurring revenue, refund rates. What you won’t see is the email campaign that warmed up the buyer, the blog post they read three weeks earlier, or the reply you sent that tipped them over.

    Monetisation dashboards are built to track transactions, not the operator actions that caused them. That gap costs you visibility into what’s actually working.

    What platforms count—and what they don’t

    Most payment and membership platforms log the moment money changes hands. Stripe records the charge, the product, the timestamp, and the customer ID. Gumroad adds a referrer if the buyer clicked through from a tracked link. Patreon shows you when a pledge started.

    What they don’t log:

    • The welcome sequence that ran before the sale
    • The specific post or episode the buyer mentioned in their signup note
    • Whether they joined during a launch window or six months later
    • How many emails they opened before converting

    You can sometimes infer this by layering your email analytics on top of your payment data, but most operators don’t—because the platforms don’t make it easy, and the dashboards don’t prompt you to ask.

    High-intent actions hide in support threads and replies

    Some of your best conversions start in places your dashboard will never see. A reader replies to your newsletter with a question. You answer. Two weeks later, they buy your course. Stripe shows the sale. Your email platform shows the reply. Nothing connects them.

    Same with DMs on social platforms, Slack community threads, or podcast listener emails. The conversion shows up in your revenue chart, but the conversion path is invisible unless you’re manually logging touchpoints.

    This isn’t a workflow problem—it’s a structural one. Payment platforms treat each transaction as isolated. Email platforms treat campaigns as separate from revenue. Attribution tools try to bridge the gap, but they only work if the buyer clicked a tracked link at the right moment.

    When someone converts outside your funnel

    Here’s a pattern that happens more often than dashboards admit: someone discovers your paid product through search, word-of-mouth, or a months-old blog post. They land on your sales page, read it, and buy—no email sequence, no retargeting ad, no tracked referrer.

    Your payment dashboard logs the sale. Your traffic analytics might show the sales-page visit. But you have no idea why they bought, what convinced them, or where they originally heard about you.

    For solo operators, this isn’t just a data curiosity—it’s a strategic blindspot. If half your revenue comes from untracked conversions, you can’t confidently double down on what works or cut what doesn’t.

    What to track outside the dashboard

    You don’t need a full attribution stack. You need a lightweight system that captures context your platform ignores.

    Start with a spreadsheet or a simple database. Every time someone buys, log:

    • Their name and email (if you have permission)
    • The product they bought
    • Any recent interaction you remember—a reply, a question, a mention
    • Where you think they found you, even if it’s a guess

    This takes two minutes per sale. For most solo operators, that’s fewer than ten entries a week. Over a quarter, you’ll spot patterns your dashboard would never surface: a specific blog post that converts, a newsletter topic that primes buyers, or a reply template that consistently leads to sales.

    If you’re running paid campaigns or affiliate partnerships, add UTM parameters to every link and check them manually in Stripe’s metadata or your platform’s transaction notes. Most tools capture referrer data—they just bury it.

    One operator’s fix

    A course creator I know was spending $800/month on Facebook ads with a 2.1x return. Her Stripe dashboard showed consistent sales, but she couldn’t tell which ad creative or audience was working.

    She started logging every sale in a Notion database, copying the UTM source from Stripe’s metadata and noting whether the buyer had opened any of her emails before purchasing. Within six weeks, she realised that her best-performing ad wasn’t driving immediate sales—it was pulling people into her email list, where they converted 30–45 days later.

    She shifted budget toward that creative, extended her email nurture sequence, and hit 3.4x return within two months. The Stripe dashboard still showed the same clean revenue bars. The difference was entirely in the context she tracked herself.

    Most dashboards optimise for reporting, not learning

    Platforms design dashboards to answer investor questions—MRR, churn, transaction volume—not operator questions like “which blog post is worth updating?” or “should I write more emails like the one I sent last Tuesday?”

    That’s not a criticism. It’s a reminder that the dashboard is a starting point, not the full picture. If you want to understand what drives your revenue, you need to track the actions and interactions that happen before the sale—even if it’s just a spreadsheet and a two-minute logging habit.

    Want more like this? Subscribe to One Two Three Send—practical breakdowns for operators running content businesses, delivered twice a week.

  • Subscription churn dashboards: what they hide about your real retention

    Subscription churn dashboards: what they hide about your real retention

    Subscription churn dashboards: what they hide about your real retention
    Photo by prashant hiremath on Unsplash

    Open your subscription dashboard—Stripe, Patreon, Memberful, whatever you use—and look at the churn number. Maybe it’s 4.2%. Maybe 8%. That single percentage is supposed to tell you how many paying members you’re losing each month.

    It doesn’t. Not really. Because that number conflates voluntary cancellations, failed payment retries, paused subscriptions that never resume, and members who downgrade to free. Each of those behaviors means something different, and grouping them into one metric makes it nearly impossible to fix the actual problem.

    Here’s what most churn dashboards don’t show you—and how to calculate it yourself.

    Voluntary vs. involuntary churn

    Most platforms lump these together. A member who clicks “Cancel subscription” counts the same as someone whose credit card expired and failed after three retry attempts.

    The fix rate for those two scenarios is radically different. Voluntary churn requires rethinking your content, pricing, or onboarding. Involuntary churn—also called passive churn—is often fixable with better dunning emails, payment method update prompts, or switching to a payment processor that retries smarter.

    Stripe reports this breakdown in the Billing dashboard under “Revenue churn” if you dig into the details tab. Memberful and Patreon don’t surface it by default. If your platform doesn’t split these, export your cancellation data and tag each one manually by looking at the cancellation reason field. Stripe’s API returns cancellation_details.reason as either cancellation_requested or payment_failed.

    In a 2025 Stripe data sample across SaaS and membership businesses, involuntary churn accounted for 20–40% of total monthly churn. That’s revenue you can recover without changing your product.

    Paused subscriptions that don’t resume

    Some platforms let members pause instead of cancel. Memberful, Patreon, and Stripe Billing all support this. The idea: give people a break, and they’ll come back.

    Except most don’t. In practice, pause behavior clusters into two groups: people who resume within 30 days, and people who never resume. If someone pauses for more than 60 days, the likelihood they reactivate drops below 12%, based on Memberful’s 2024 creator survey data.

    But paused accounts don’t show up in your churn number. They sit in limbo. Your dashboard still counts them as “members,” even though they’re not paying and statistically won’t return. This inflates your retention rate and makes your churn look better than it is.

    Fix: track “effective churn” by counting any pause longer than 60 days as a cancellation. Export your active and paused subscriber lists monthly, tag pauses by start date, and flag anyone past the 60-day mark. Add that to your churn count.

    Downgrades to free tiers

    If you offer a free tier, a member who downgrades from paid to free isn’t technically churned—they’re still subscribed. But they’re no longer paying you. Revenue-wise, they’re gone.

    Stripe and Memberful count this as “downgrade,” not churn. Patreon counts it as churn only if the member drops to $0. Beehiiv‘s dashboard treats it as a “tier change.” The taxonomy varies, and that inconsistency makes cross-platform comparison nearly impossible.

    What matters: are you tracking revenue churn (loss of MRR) or logo churn (loss of accounts)? Most solo operators look at logo churn because it’s the default number. But if you have multiple tiers, revenue churn is the better signal. A $10/month member canceling hurts less than a $100/month member downgrading to $10.

    Stripe’s MRR movement report breaks this down. For other platforms, calculate it manually: take last month’s MRR, subtract this month’s MRR from the same cohort, divide by last month’s MRR. That’s your revenue churn rate.

    Cohort decay vs. headline churn

    Your dashboard’s churn percentage is almost always a cross-sectional average: total cancellations this month divided by total active subscribers. That number is useful for month-over-month tracking, but it doesn’t tell you if your problem is early churn (people leaving in month one) or late churn (long-time members leaving after a year).

    Cohort retention does. Group members by signup month, then track what percentage of each cohort is still paying after 1 month, 3 months, 6 months, 12 months. If your month-one retention is 70% but month-twelve retention is 85%, your onboarding is the problem, not your long-term content. If month-one retention is 90% but month-twelve is 50%, you have a content staleness issue.

    Stripe’s cohort analysis tool shows this under Billing > Reports > Retention analysis. For platforms without native cohort tracking, export your subscriber data with signup dates and payment statuses, then pivot it in a spreadsheet by cohort month.

    What to do with this

    If you’re running a paid membership or subscription product, calculate these four numbers separately every month:

    • Voluntary churn rate
    • Involuntary churn rate
    • Pauses older than 60 days (as a percentage of total members)
    • Revenue churn rate (if you have multiple tiers)

    Then track month-one and month-twelve retention for at least three cohorts. That gives you six data points instead of one, and each one points to a different fix.

    Most subscription dashboards want to show you a single number because it’s easier to design and easier to sell. But one number can’t tell you why people leave, and you can’t fix churn if you don’t know which kind you have.

    Want more breakdowns like this? Subscribe to One Two Three Send for weekly deep-dives on the tools and metrics that actually matter for online operators.

    Heads up — some links in this article are affiliate links. If you sign up through them, we may earn a small commission at no extra cost to you. We only recommend tools we use ourselves.