
Category: Traffic

  • SEO keyword cannibalization: when two posts compete and both lose

    SEO keyword cannibalization: when two posts compete and both lose

    SEO keyword cannibalization: when two posts compete and both lose
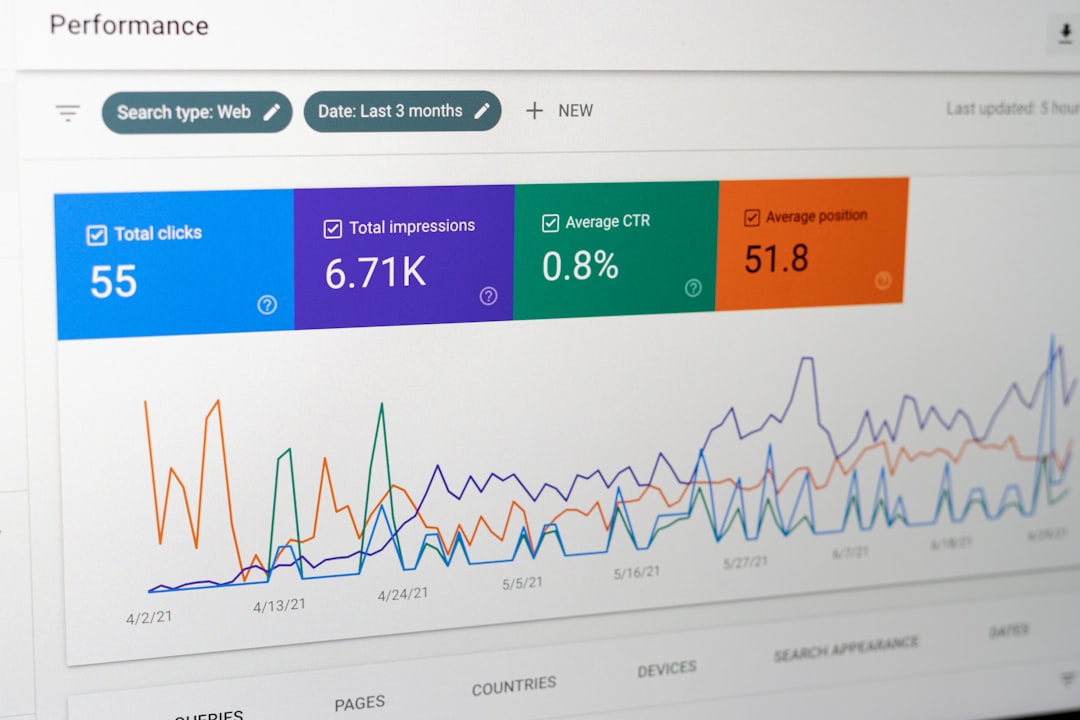
    Photo by Merakist on Unsplash

    You publish a post on “best email automation tools” in March. It ranks on page two. In June, you write another piece on “email automation platforms for small businesses.” Google now has two targets for the same search intent—and neither breaks page one.

    This is keyword cannibalization: when your own content competes against itself. Search engines don’t know which page to prioritize, so they split the ranking signal between both. You lose traffic, authority, and conversion potential on a topic you should own.

    Most solo operators don’t notice until months later, when a high-effort post underperforms and the analytics show an older piece siphoning impressions.

    How to spot cannibalization in your content

    Open Google Search Console. Navigate to Performance, then filter by query. Pick a target keyword you care about—something with commercial intent or steady volume.

    Click into the query detail. Scroll to Pages. If you see two or more URLs listed with similar impression counts, you have cannibalization. Neither page is dominant; Google is rotating which one appears in results.

    The clearest signal: impression counts split 60/40 or closer. If one page holds 95% of impressions, you don’t have a problem—that’s hierarchical ranking. But when impressions distribute evenly, search engines see both as equally relevant and neither as authoritative.

    Check position data next. Cannibalizing pages often hover between position 8 and 20. They’re indexed, they’re relevant, but they’re not winning because the ranking signal is diluted.

    Which post to keep, which to redirect

    Decide based on three factors: backlinks, traffic history, and content depth.

    In Search Console, compare total clicks over the last 90 days. The page with higher cumulative clicks has momentum. If the margin is tight, check external backlinks using a tool like Ahrefs or your hosting analytics referrer log. The page with more inbound links carries more authority.

    If both posts have similar metrics, pick the one with better content structure—clearer headings, more examples, updated tooling references. That’s your canonical target.

    Once you’ve chosen, you have two options:

    • 301 redirect: Delete or unpublish the weaker post and redirect its URL to the stronger one. This consolidates link equity and tells Google the authoritative page.
    • Canonical tag: Keep both posts live but add a rel="canonical" tag on the weaker page pointing to the stronger one. Use this when the weaker post still serves a secondary audience or internal linking structure.

    Redirects are cleaner. Canonical tags are useful when you want to preserve a slightly different angle but still signal priority to search engines.

    Merge content instead of deleting

    Before you redirect, audit both posts for unique value. The weaker post might have a better example, a clearer how-to section, or updated pricing data.

    Copy those sections into the stronger post. Rewrite transitions so the merge feels intentional, not Frankenstein. Update the publish date if your CMS supports it, or add a note at the top: “Updated July 2026 with new tools and consolidated guidance.”

    This approach gives you one definitive resource instead of two mediocre ones. Readers get more value per click, and Google sees a single, comprehensive answer.

    After merging, set up the 301 redirect from the old URL to the updated post. Traffic will consolidate within two to four weeks as Google recrawls and reassigns ranking signals.

    Prevent future cannibalization with a content map

    Track your target keywords in a spreadsheet. Three columns: Keyword, Primary URL, Publish Date.

    Before drafting a new post, search your own site. Use site:yourdomain.com "keyword phrase" in Google. If a post already covers the topic, update that post instead of creating a new one.

    If you need a new angle—say, a beginner’s guide vs. an advanced deep-dive—make the keyword targeting explicit. Use different modifiers: “how to start” vs. “advanced strategies for.” Give Google clear semantic separation.

    Internal linking also matters. When you mention a keyword in passing, link to your primary post on that topic. This signals hierarchy and reinforces which page you want ranking.

    Cannibalization isn’t a catastrophe, but it’s invisible drag on growth. Fix it once, and your best content starts working harder.

    One Two Three Send covers SEO, hosting, and content tooling for solo operators. Subscribe for weekly breakdowns of what actually moves the needle.
  • Paid social ad budgets below $500/month: when to stop and redirect

    Paid social ad budgets below $500/month: when to stop and redirect

    Paid social ad budgets below $500/month: when to stop and redirect
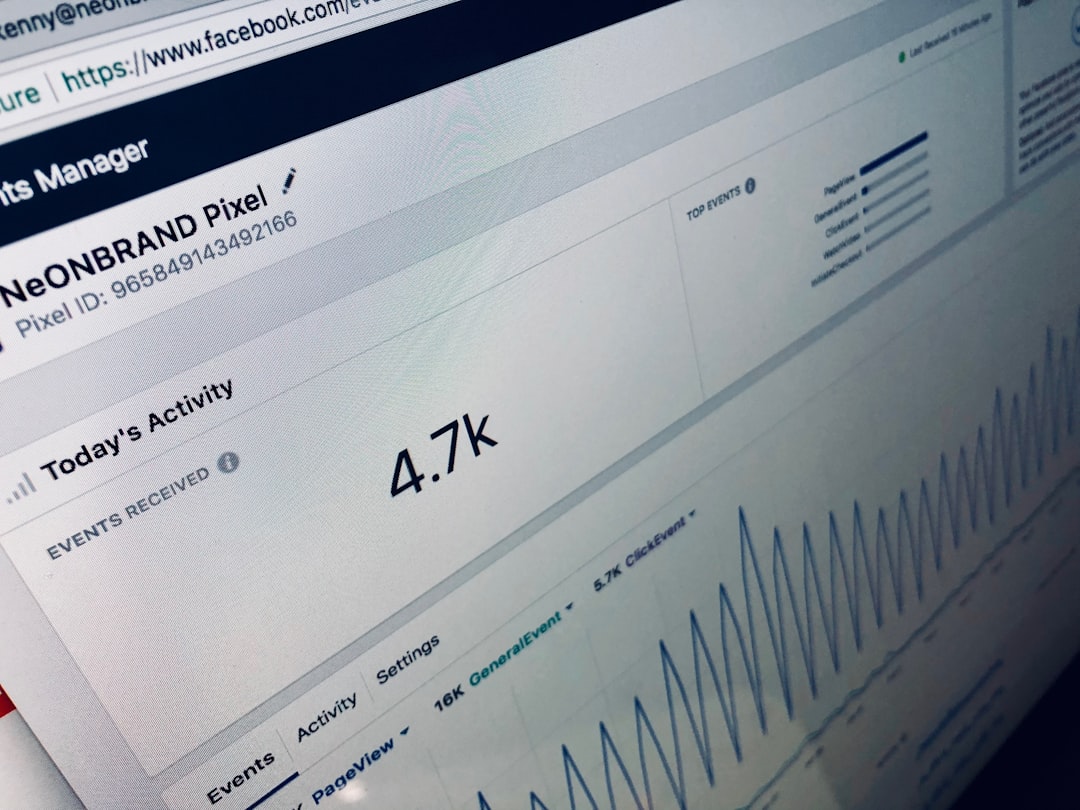
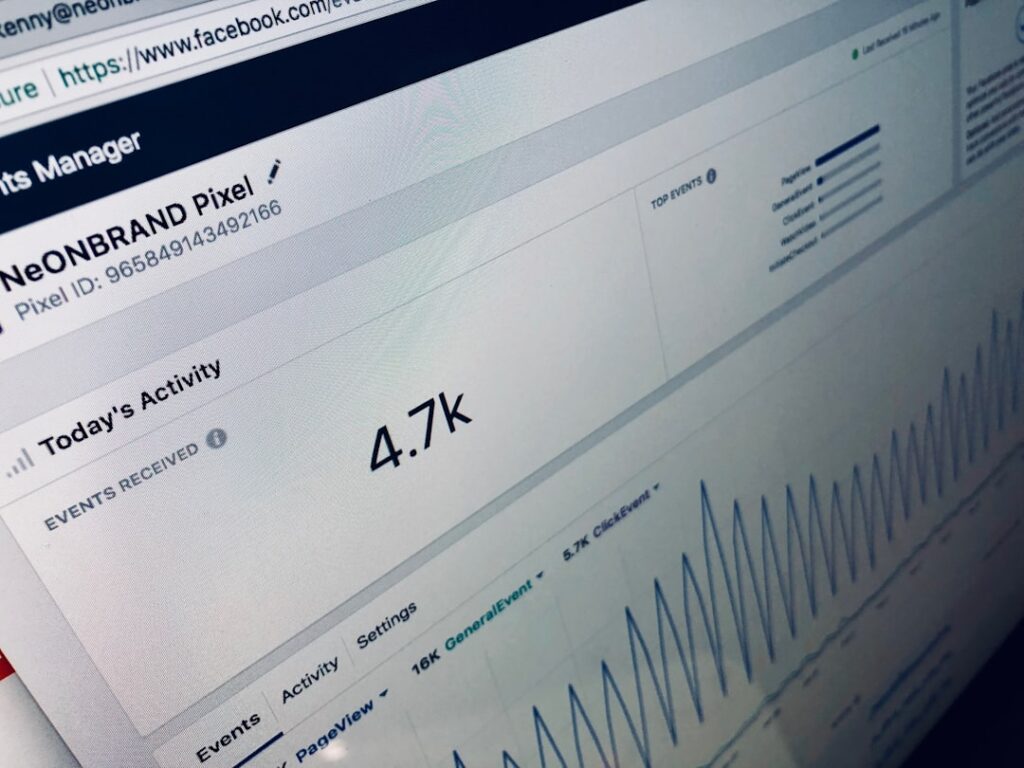
    Photo by Quilia on Unsplash

    Most solo operators running paid social ads are spending just enough to lose money slowly. Not because the creative is bad or the targeting is wrong—but because platforms like Facebook, Instagram, and LinkedIn need minimum spend thresholds to exit learning phases and deliver stable results.

    If you’re spending under $500 per month on paid social, you’re likely feeding the algorithm without ever reaching the point where it can optimize effectively. Here’s when to pull the plug and put that budget somewhere else.

    Learning phases eat small budgets alive

    Facebook’s ad delivery system enters a “learning phase” every time you launch a new ad set. During this period—typically 50 conversions or about 7 days—the algorithm tests placements, audiences, and delivery patterns. Performance is unstable, cost per result is high, and you’re essentially paying for the platform to figure out what works.

    If your monthly budget is $300 and you’re optimizing for a conversion that costs $15, you’re generating 20 conversions per month. That’s not enough to exit learning on even one ad set, let alone test variants or scale what works. You reset the learning phase every time you tweak creative, adjust targeting, or pause for a few days.

    LinkedIn is worse. The platform recommends a minimum daily budget of $10 per campaign and suggests at least $5,000 in lifetime spend to gather meaningful data. At $400/month, you’re running a single campaign for weeks without enough signal to know if your targeting is directionally correct.

    Platform minimums and daily spend floors

    Beyond learning phases, each platform enforces daily or lifetime budget minimums that make small budgets impractical:

    • Facebook/Instagram: $1/day minimum per ad set, but realistic delivery starts around $5–10/day depending on audience size and objective.
    • LinkedIn: $10/day minimum per campaign. Sponsored Content and Message Ads often require $15–20/day to see consistent delivery.
    • Twitter/X: Minimum $5/day, but impressions taper off fast below $20/day.

    If you’re spending $300/month across two platforms, you’re looking at $5/day per platform—barely clearing minimums, never reaching statistical significance, and constantly restarting learning cycles when budget runs out mid-month.

    When organic or email wins instead

    Below $500/month, your budget is better spent on channels that don’t penalize you for small scale:

    Organic social scheduling and repurposing. A $15/month tool like Publer or Buffer lets you schedule posts across networks, repurpose content into multiple formats, and maintain consistent presence without paying for each impression. You lose paid reach, but you also stop hemorrhaging budget into learning phases that never resolve.

    Email list growth via lead magnets. Put $200/month into a freelance designer for lead magnet PDFs, landing page tweaks, or content upgrades. Pair that with organic promotion and you’re building an owned channel that doesn’t reset when you pause spend. Platforms like MailerLite or Brevo let you grow to 1,000+ subscribers for free or under $15/month, and every subscriber you add compounds over time.

    Low-cost traffic tests via solo ads or newsletter sponsorships. If you need paid traffic and have a tight budget, solo ads in your niche (typically $0.30–0.70 per click) or small newsletter sponsorships ($50–150 per placement) give you fixed-cost exposure without algorithmic gatekeeping. You know exactly what you’re paying per visitor, and there’s no learning phase tax.

    The breakpoint: $500/month, single platform, single objective

    If you’re committed to paid social, here’s the minimum viable threshold:

    • $500+/month on one platform (not split across three)
    • One conversion objective (not awareness + traffic + conversions in parallel)
    • At least 50 conversions per month to exit and re-enter learning without burning budget

    Below that, you’re paying for noise. The algorithm can’t learn, you can’t test, and your cost per result stays artificially high because the platform never stabilizes delivery.

    Run the math on your last 90 days. If your monthly spend averages under $500 and you’re not seeing consistent cost-per-result improvements month over month, pull the budget. Redirect it to owned channels, test organic tactics for 60 days, and return to paid social only when you have the budget to clear learning phases without restarting every week.

    Reply with your current monthly paid social spend and conversion count—I’ll tell you if you’re above or below the threshold where the algorithm can actually work.

    Heads up — some links in this article are affiliate links. If you sign up through them, we may earn a small commission at no extra cost to you. We only recommend tools we use ourselves.

  • Google Search Console filtered data exports cap at 1,000 rows

    Google Search Console filtered data exports cap at 1,000 rows

    Google Search Console filtered data exports cap at 1,000 rows
    Photo by Justin Morgan on Unsplash

    Google Search Console lets you filter queries, pages, countries, devices—then export the results as a CSV. What the interface doesn’t tell you: any export caps at 1,000 rows, even if your filtered view shows “12,483 rows available.”

    If you run a content site with more than a few dozen published pieces, you’ve likely hit this ceiling without realizing it. The export completes without error. The file opens fine. You just never see row 1,001.

    Where the cap appears

    The 1,000-row limit applies to:

    • Performance report exports (queries, pages, countries, devices, search appearance)
    • Links report exports (top linking sites, top linking text)
    • Any filtered view, whether you’ve applied one filter or ten

    It does not apply to the API—more on that below.

    The cap exists across date ranges. If you’re exporting six months of query data and 4,200 queries triggered impressions, you’ll get the top 1,000 by impressions, sorted descending. The rest disappear.

    Why it matters for solo operators

    Most online-business operators export Search Console data for:

    • Finding low-hanging SEO opportunities (pages ranking 8–20 that could move up)
    • Identifying keyword cannibalization (multiple URLs competing for the same query)
    • Auditing underperforming content (impressions without clicks)
    • Building editorial calendars around actual search demand

    If your site has more than 1,000 indexed pages—or if you publish frequently enough that 1,000 queries have triggered impressions in the last 90 days—you’re analyzing an incomplete dataset every time you export.

    The pages that fall outside the top 1,000 by impressions are often the ones worth investigating: older posts that still rank but underperform, or newly published pieces that haven’t accumulated enough impressions to crack the top of the list.

    Three ways to pull complete data

    1. Tighten your filters before exporting. Instead of exporting all queries, filter by page first. Export queries for one URL at a time. Each per-page export will stay well under 1,000 rows unless you’re running a major publication. Tedious, but it works without code.

    2. Use the Search Console API. Google’s Search Console API returns up to 25,000 rows per request. You can script this in Python (the google-api-python-client library is well-documented), or use a no-code tool like Supmetrics or Coupler.io to pull data into Google Sheets. Expect to spend 30–60 minutes on initial setup if you’re not familiar with API authentication, but once it’s running, you can automate weekly or monthly pulls.

    3. Use Google Sheets’ built-in Search Console connector. In Sheets, go to Data > Data connectors > Connect to Search Console (previously called “Search Console add-on”). It uses the API under the hood, so you bypass the 1,000-row cap. Free, no coding required. The interface is slower than a CSV export, and you’ll need to refresh manually, but for most solo operators, this is the sweet spot between effort and completeness.

    What gets cut when you don’t notice

    I pulled a recent 28-day Performance report for a 200-page content site. The browser interface showed 2,103 queries. The CSV export contained exactly 1,000.

    The missing 1,103 queries had:

    • 14,822 total impressions (roughly 11% of the site’s total for the period)
    • 127 clicks
    • An average position of 24.3

    Those are queries where the site ranks on page 2 or 3—exactly the ones worth targeting for on-page optimization or internal linking. The export silently excluded them.

    One non-obvious detail

    When you export from a filtered view, Search Console sorts by the primary metric column (usually impressions) before applying the 1,000-row cap. If you’ve toggled the Performance chart to sort by clicks or position, the export still sorts by impressions. The UI doesn’t update to reflect this. If you want the top 1,000 queries by clicks, you’ll need to export, then re-sort in your spreadsheet—or use the API and specify orderBy: 'clicks' in your request.

    If you’re running content acquisition strategies based on Search Console exports, audit your row counts. If you’re seeing exactly 1,000 rows in every export, you’re working with a sample, not the full picture.

    Want more tooling breakdowns like this? Subscribe to One Two Three Send—one operator-focused article every day, no fluff.

  • SEO traffic declines after switching hosts—DNS TTL is why

    SEO traffic declines after switching hosts—DNS TTL is why

    SEO traffic declines after switching hosts—DNS TTL is why
    Photo by Justin Morgan on Unsplash

    Move a WordPress site to a new host, watch organic traffic drop 15–30% for three to five days, then recover. If you’ve migrated hosting recently, you’ve probably seen this pattern. The culprit isn’t downtime, broken redirects, or angry Google crawlers—it’s DNS Time To Live (TTL) settings interacting badly with search engine cache behavior.

    Most solo operators treat host migration as a one-afternoon task: export database, move files, update DNS A record, wait. But DNS propagation isn’t instant, and search engines don’t immediately trust the new IP. The gap between those two realities creates a window where crawlers hit stale IPs, time out, or mark pages unreachable.

    What TTL does during migration

    DNS TTL tells browsers and crawlers how long to cache your domain’s IP address before checking again. If your TTL is set to 86400 seconds (24 hours)—a common default—and you migrate hosting, visitors and bots will keep hitting the old IP for up to a full day after you update DNS.

    That’s fine for human visitors using browsers with retry logic. It’s terrible for search crawlers operating on tight schedules. Googlebot doesn’t wait around. If your old host shuts down the account before TTL expires, crawlers see timeouts. Timeouts signal unreliability. Unreliability triggers temporary ranking suppression while Google reassesses your site’s health.

    The fix is simple but requires planning a week ahead: lower your DNS TTL to 300 seconds (five minutes) at least 48 hours before migration. This ensures that by the time you flip the DNS A record, cached lookups expire within minutes, not hours.

    Why old hosts break this silently

    Most shared and managed WordPress hosts auto-cancel accounts within hours of migration completion. You export your files, move DNS, and assume the old server stays online long enough for TTL to expire. It doesn’t.

    If your old host deactivates your account six hours after DNS changes, but your TTL is still set to 24 hours, a large percentage of cached DNS lookups will resolve to a dead IP for the next 18 hours. Crawlers see repeated failures. Analytics show a sudden drop in organic sessions. By the time TTL expires and traffic recovers, you’ve already lost several days of visibility in search results.

    Hosts rarely warn you about this because DNS management sits outside their direct responsibility—it’s handled by your registrar or a separate DNS provider like Cloudflare. The coordination gap means the problem only surfaces after migration is complete.

    The pre-migration checklist

    Start by logging into your DNS provider (Cloudflare, your registrar, or wherever your nameservers point). Locate the A record for your root domain and www subdomain. Check the TTL value—if it’s above 3600 seconds (one hour), lower it to 300.

    Wait 48 hours. This gives the current high TTL time to expire across the internet’s DNS cache layers. If you skip this step and lower TTL five minutes before migration, the old 24-hour TTL is still active everywhere—your change won’t take effect in time.

    Migrate your site. Update DNS A records to the new host’s IP. Keep the old hosting account active for at least 24 hours after DNS changes, even with the low TTL. This provides a safety buffer for any lagging DNS resolvers or aggressive caching layers.

    Monitor Google Search Console’s crawl stats and Coverage report during the 72 hours post-migration. If you see a spike in server errors or timeouts, your TTL window was too short or the old host deactivated too early. You can’t fix it retroactively, but you’ll know what broke.

    When managed hosts handle DNS

    Some managed WordPress hosts—Flywheel, WP Engine, Kinsta—offer DNS management as part of their platform. If your domain’s nameservers point directly to your host, TTL control sits inside their dashboard, and migration becomes trickier.

    These hosts typically manage TTL automatically, and you may not have manual override. The workaround: move DNS to a standalone provider (Cloudflare’s free tier works) at least a week before migration. Point your domain’s nameservers to Cloudflare, replicate all DNS records, lower TTL, then migrate hosting. It adds a step, but it gives you control over the timing.

    If you’re migrating to a managed host that includes DNS, ask support whether they lower TTL automatically during migrations. Most don’t. If they can’t confirm, assume you need to handle it manually.

    One operator I work with migrated a 40,000-session-per-month site from shared hosting to BigScoots in June. They followed the 48-hour TTL reduction, kept the old account live for 36 hours post-migration, and saw zero crawl errors in Search Console. Organic traffic dipped 4% for two days—within normal daily variance—then returned to baseline. Total cost of the precaution: two extra days of overlap billing at $6. Cost of not doing it: potentially two weeks of suppressed rankings while Google re-crawls and re-establishes trust.

    If you’re planning a host migration in the next quarter, add “lower DNS TTL 48 hours early” to your runbook now. It’s the one step that prevents an invisible SEO penalty most operators don’t connect to hosting until it’s too late.

    Have a hosting or infrastructure question you’d like covered? Reply to this email—I read every one.

  • SEO title tag length in 2026: Google’s display cap vs. ranking weight

    SEO title tag length in 2026: Google’s display cap vs. ranking weight

    SEO title tag length in 2026: Google's display cap vs. ranking weight
    Photo by CDC on Unsplash

    Title tags still matter for SEO in 2026—but not the way most operators think.

    Google displays roughly 55–60 characters in desktop search results and around 50 on mobile. Overflow gets truncated with an ellipsis. That’s the display cap. But Google reads and indexes the full tag, often 100+ characters, for ranking context. The gap between what shows and what counts creates a structural problem: do you write for the click or for the algorithm?

    The answer is both, but in sequence.

    Front-load the hook, back-load the context

    Think of your title tag in two zones. Characters 1–55 are the display zone: what a searcher sees. Characters 56–100+ are the context zone: what Google reads but doesn’t show.

    The display zone should contain your primary keyword and the click-worthy hook. This is what earns the click. If your article is about WordPress caching plugins, lead with “WordPress caching plugins” or “Best caching plugins for WordPress” depending on keyword priority. Put the brand, qualifier, or year at the front only if search intent demands it.

    The context zone is where you add semantic richness. Secondary keywords, modifiers, edge-case terms—anything that strengthens topical relevance without cluttering the visible headline. For a caching plugin comparison, the context zone might include “speed, performance, CDN integration, WP Engine, LiteSpeed” even if none of that shows in the SERP.

    Google uses the full string to understand your page. Truncation doesn’t mean the invisible portion is ignored—it just doesn’t influence the click. Ranking and click-through rate are separate optimizations.

    When to keep it short anyway

    Not every page needs a long title tag. Homepages, product pages, and branded queries often perform better with tight, 40–50 character tags. If your brand or product name is the primary search term, front-load it and stop. Adding filler keywords dilutes clarity and can hurt both ranking and CTR.

    Transactional pages—signup flows, checkout, account dashboards—rarely benefit from long tags. These pages don’t compete in organic search the way content does. Keep the tag descriptive, skip the keyword stacking.

    But for content pages—blog posts, guides, comparisons, tutorials—the two-zone structure works. You’re balancing human scannability with algorithmic comprehension, and the title tag is one of the few places where you can do both in the same element.

    Avoiding keyword cannibalization in the back half

    The context zone is not a keyword dumping ground. If you stuff unrelated terms, Google may misread your page’s focus and rank it for the wrong query—or not rank it at all.

    Stick to semantic neighbors: terms a human would associate with the main topic. For a guide on email deliverability, context-zone terms might include “DMARC, SPF, spam filters, inbox placement.” Don’t add “newsletter growth” or “monetization” unless the page actually covers those. Relevance clustering matters more than keyword density.

    Also watch for overlap with other pages on your site. If you have three posts about WordPress caching and all three use identical context-zone keywords, you’re signaling to Google that the pages are interchangeable. Differentiate the back half of each tag to clarify which page targets which sub-topic.

    Testing what actually moves traffic

    Title tag changes show up in Google Search Console within days, sometimes hours. If you adjust a tag, filter GSC by page URL and compare impressions, average position, and CTR before and after. Give it two weeks for stabilization—one weekend of data isn’t enough.

    Look for position changes first. If the page jumps from position 8 to position 4, the context zone likely improved topical relevance. If CTR climbs but position holds steady, the display zone got more compelling. If both drop, you either diluted focus or triggered a relevance mismatch.

    For high-traffic pages, A/B test cautiously. Change one zone at a time. If you rewrite both the display hook and the context keywords simultaneously, you won’t know which variable moved the needle.

    Title tags aren’t magic, but they’re one of the few on-page signals you control entirely. Write for the searcher in the first 55 characters. Write for the algorithm in the next 45. Don’t conflate the two, and don’t ignore either.

    Want more search traffic breakdowns? Reply with the ranking question you’re stuck on—we’ll cover it in a future issue.

  • SEO content briefs bloat without distribution clauses

    SEO content briefs bloat without distribution clauses

    SEO content briefs bloat without distribution clauses
    Photo by 1981 Digital on Unsplash

    Content briefs have become the operational backbone of SEO-driven online businesses. You spec the keyword, set the word count, list the headers, and hand it off to a writer or AI tool. The piece gets published, indexed, and then… nothing happens.

    The problem isn’t the research or the writing. It’s that most briefs treat distribution as someone else’s problem. They specify what to write but ignore how the content will reach readers beyond organic search. That gap costs you traffic, backlinks, and the compounding effects that turn a solid article into a referral engine.

    Why briefs skip distribution

    SEO content briefs evolved from agencies optimising for clients who measured success by rankings and organic sessions. The writer’s job was to satisfy search intent and hit keyword density targets. Distribution—social sharing, outreach, newsletter inclusion—lived in a separate swim lane, often handled by a different team or not at all.

    That division made sense when content teams had 15 people. For solo operators and small teams, it’s structural debt. You’re the writer, the editor, the SEO lead, and the distribution manager. If the brief doesn’t prompt you to think about distribution during the planning phase, you’ll publish and move on. Two weeks later, the post has 40 pageviews and zero inbound links.

    The fix isn’t to bolt a distribution checklist onto the end of your brief. It’s to bake distribution constraints into the content structure before you write.

    What a distribution clause looks like

    A distribution clause is a single section in your brief—usually 3–5 bullet points—that answers: How will this piece spread beyond Google?

    Here’s what it includes:

    • Primary shareability hook: What one sentence, stat, or contrarian claim will make someone want to link or quote this? Write it in the brief before you write the article.
    • Outreach targets: List 3–5 specific sites, newsletters, or operators who’d care about this topic. If you can’t name them, the topic might be too broad or too niche.
    • Social/email angle: How will you frame this for your own newsletter or social channels? If the article can’t carry a compelling subject line, it won’t drive repeat traffic.
    • Republish or excerpt plan: Can a section of this piece work as a standalone post on Medium, LinkedIn, or a guest slot? Spec that upfront.
    • Linkable asset: Does the article include a chart, data table, or tool comparison that others will reference? If not, add one.

    These aren’t aspirational. They’re constraints. If you can’t fill out the clause, the brief isn’t ready.

    When it changes what you write

    Adding a distribution clause doesn’t just remind you to promote the piece. It reshapes the content itself.

    Example: You’re writing a comparison of WordPress caching plugins. Your original brief specifies 1,800 words, keyword density for “WordPress caching,” and a table comparing five plugins. Standard SEO play.

    Now add a distribution clause. Your outreach targets include two WordPress hosting review sites and a performance-focused newsletter. Your shareability hook is a load-time test showing one plugin slowing a site by 300ms under certain conditions. Suddenly, you’re not writing a neutral comparison—you’re writing a piece with a counterintuitive finding that those sites will want to link to. You structure the article to lead with the unexpected result, bury the methodology in an appendix, and pull the data table into a standalone image optimised for social sharing.

    Same keyword. Same word count. Completely different content architecture, because you planned distribution before you wrote the first sentence.

    How to retrofit existing briefs

    If you’re already using a content brief template—whether it’s a Notion doc, a Google Sheet, or a prompt you feed into an AI tool—add a “Distribution” section immediately after “Target keyword” and before “Outline.”

    For AI-assisted workflows, include the clause in your prompt. Example:

    “Before outlining, identify: (1) the single most shareable claim in this piece, (2) three sites or newsletters that would link to it, and (3) one chart or data point that makes the piece link-worthy.”

    If the AI or your own brainstorming can’t answer those three questions, either the topic needs refinement or the piece won’t spread. Kill it or rework it before you write 1,500 words.

    The compound effect

    Content with built-in distribution hooks doesn’t just get more initial traffic. It builds backlink velocity, which lifts your domain authority and helps other posts rank. A single well-distributed piece can pull up a category of related content.

    Operators running lean don’t have the budget to publish 40 articles a month and hope three break out. You need a higher hit rate. Distribution clauses raise the floor. Every piece you publish has a plan to reach readers beyond the search algorithm.

    Start with your next brief. Add the section. If you can’t fill it out, don’t write the article yet. That discipline alone will cut your content calendar by a third—and double the traffic on what remains.

    One Two Three Send covers the tools, tactics, and trade-offs for running a content-driven online business. Subscribe to get the next piece in your inbox.

  • Paid ads attribution windows shrink to one day—what that breaks

    Paid ads attribution windows shrink to one day—what that breaks

    If you’re running paid ads to grow your newsletter, course, or content site, you’ve probably noticed something strange in your dashboard: conversions are lower than you remember, even when traffic and spend stay flat.

    The culprit isn’t your creative or your targeting. It’s attribution windows—and both Meta and Google have quietly tightened them over the past two years.

    As of mid-2023, Meta Ads defaults to a 1-day click attribution window for most campaign objectives. Google Ads moved to a similar model in 2022, deprecating its 30-day window for most conversions. That means if someone clicks your ad on Monday but converts on Wednesday, the platform won’t count it.

    For solo operators running lean budgets, this shift breaks the feedback loop between what you spend and what you earn.

    What attribution windows actually measure

    An attribution window defines how long a platform will credit a conversion back to an ad click or impression. If you set a 7-day click window, any purchase or sign-up that happens within seven days of someone clicking your ad gets attributed to that campaign.

    Shorter windows make your ads look less effective. Longer windows inflate performance by claiming credit for conversions that might have happened anyway.

    Until recently, the industry standard was 7 days for clicks and 1 day for views. Meta offered 28-day windows as an option. Google let you choose up to 90 days in some cases.

    Now the defaults have contracted. Meta’s 1-day click window is the starting point for Conversions, Traffic, and Engagement campaigns. Google’s data-driven attribution model leans heavily on same-day conversions, especially for campaigns tied to GA4 events.

    Why the change? Privacy regulations like iOS 14.5’s App Tracking Transparency and Europe’s GDPR made cross-device and delayed attribution harder to track. Platforms responded by shortening windows and leaning on modeled conversions—which are estimates, not direct measurements.

    What a 1-day window hides

    Most online-business funnels don’t convert in 24 hours. Someone sees your ad, clicks through, reads your welcome sequence, thinks about it, then buys three days later. A 1-day window only credits the ad if they purchased the same day they clicked.

    Here’s what gets lost:

    • Email nurture sequences. If your funnel includes a three-email welcome series, conversions will happen 48–72 hours after the click. The ad won’t get credit, even though it drove the subscriber.
    • Comparison shoppers. People researching courses, memberships, or SaaS tools often take a week to decide. A 1-day window treats that as organic, not paid.
    • Mobile-to-desktop conversions. Someone clicks your ad on their phone during lunch, then completes checkout on their laptop that evening. If it’s past midnight UTC, that’s day two—no attribution.

    The result: your dashboard shows a cost per acquisition that’s higher than reality, and campaigns that actually work look marginal or unprofitable.

    When to extend the window manually

    Both Meta and Google let you adjust attribution windows, but the settings are buried.

    In Meta Ads Manager, go to your campaign settings, scroll to Attribution Setting, and change the window to 7-day click or 7-day click + 1-day view. You can’t go longer than 7 days anymore, but that’s still better than one.

    In Google Ads, navigate to Tools → Conversions, select your conversion action, and edit the attribution model. Switch from “Data-driven” to “Time decay” or “Last click” with a 7- or 30-day window if you’re tracking conversions via Google Analytics 4 or a third-party pixel.

    Extend the window if:

    • Your average time-to-purchase is longer than 24 hours (check your CRM or Stripe data).
    • You’re running ads to a lead magnet with a backend offer—initial conversions happen fast, but paid conversions take days.
    • Your checkout process requires account creation, which adds friction and delays.

    Don’t extend it if you’re optimizing for same-day actions like webinar registrations or flash-sale purchases. In those cases, a 1-day window gives cleaner signal and avoids over-crediting ads for organic repeat traffic.

    How to measure what the platform misses

    Even if you extend the attribution window, you won’t capture everything. Platforms can’t see conversions that happen off-pixel—like someone who sees your ad, searches your brand name two days later, and buys via organic search.

    To fill the gap, track first-touch attribution in your own analytics. Add UTM parameters to every ad (e.g., utm_source=meta&utm_medium=cpc&utm_campaign=spring-launch). When someone converts, check the UTM values stored in your CRM or analytics tool to see which ad introduced them, even if the platform didn’t credit it.

    Tools like Plausible, Fathom, or Google Analytics 4 let you build custom reports showing conversions by first UTM source. Compare that to what Meta or Google report. The difference is what the 1-day window hid.

    If the gap is large—say, your CRM shows 40 conversions from Meta ads but Meta only reports 22—your actual cost per acquisition is lower than the dashboard suggests. That’s the signal to keep spending, even when the platform tells you to pause.

    One more tactic: ask new customers how they found you. A simple post-purchase question (“Where did you first hear about us?”) surfaces attribution that no pixel can track. If half your buyers say “Facebook ad,” but Meta only credits a quarter of revenue, you know the window is under-counting.

    Want more breakdowns like this? Subscribe to One Two Three Send for weekly deep-dives on the tools and tactics that actually move the needle for solo operators.

  • Google Search Console’s URL Inspection Tool: What It Actually Tests

    Google Search Console’s URL Inspection Tool: What It Actually Tests

    Google Search Console’s URL Inspection tool sits at the top of every SEO operator’s diagnostic stack. You paste a URL, hit Enter, and get a verdict: indexed or not, crawlable or blocked, mobile-friendly or broken.

    But the tool checks more than you think—and sometimes lies about what it finds. Here’s what actually happens when you inspect a URL, what the results mean, and when to ignore them entirely.

    What the Tool Actually Checks

    When you run an inspection, Google fetches the live version of your page and compares it against the last indexed snapshot. The report breaks into two columns: URL is on Google (the indexed version) and Live Test (what Googlebot sees right now).

    The live test runs through:

    • Crawlability: Can Googlebot access the page? Checks robots.txt, meta robots tags, X-Robots-Tag headers, and server response codes.
    • Rendering: Does the page load JavaScript successfully? Google uses a recent Chromium version, but timeouts still happen.
    • Mobile usability: Viewport settings, text size, tap target spacing. Google indexes mobile-first, so this matters even if your traffic skews desktop.
    • Structured data: Parses schema.org markup and flags errors or warnings.
    • Canonical tag: Confirms whether your declared canonical matches Google’s selected canonical.

    The indexed column shows what Google already cached. If you recently changed the page, the two columns won’t match. That’s normal—but it also means you can’t trust the indexed column to reflect current reality.

    When the Tool Misleads You

    The live test doesn’t guarantee indexing. It only proves Googlebot can crawl the page. Google may still choose not to index it due to quality signals, duplicate content, or crawl-budget constraints.

    I’ve seen pages pass every live test—green across the board—yet remain excluded for months. The tool won’t tell you why. You’ll need to cross-reference the Coverage report and check for “Crawled – currently not indexed” or “Discovered – currently not indexed” flags.

    The rendering preview also lies occasionally. Google’s renderer times out after five seconds for most JavaScript execution. If your React app or WordPress theme loads critical content late, the preview may show a blank page even though real users see the full layout. Compare the screenshot against an incognito browser session to catch this.

    Structured data validation in the URL Inspection tool is stricter than the separate Rich Results Test. A page might fail in the inspector but still earn rich snippets in search. If you’re optimizing for featured snippets or product schema, validate in both tools.

    The “Request Indexing” Button and What It Actually Does

    After running a live test, you can click Request Indexing. Google adds the URL to a priority crawl queue, but it’s not instant—and it’s not a guarantee.

    The queue processes within a few hours to a few days, depending on your site’s overall crawl budget and domain authority. High-authority sites see faster indexing. New domains or sites with thin content wait longer.

    You get a limited number of indexing requests per property per day. Google doesn’t publish the exact quota, but operators report hitting limits around 10–12 requests in 24 hours. If you’re launching a batch of new pages, prioritize the ones that drive revenue or backlink to other content.

    One non-obvious tip: request indexing for your XML sitemap URL itself after adding new pages. This signals Google to re-crawl the sitemap and discover the new URLs faster than waiting for the next scheduled sitemap fetch.

    When to Use It vs. When to Wait

    Use the URL Inspection tool when:

    • You’ve fixed a crawl error or removed a noindex tag and need to confirm the change took effect.
    • You’ve published time-sensitive content—event coverage, product launches, breaking commentary—and need Google to pick it up within hours.
    • You’ve updated a high-traffic page and want to verify rendering before Google re-indexes on its own schedule.
    • You’re debugging why a page isn’t appearing in search despite being live for weeks.

    Skip it when:

    • You’re publishing evergreen content that doesn’t compete on speed. Let Google’s normal crawl cycle handle it.
    • You’ve already requested indexing for the same URL in the last 48 hours. Repeated requests don’t speed things up.
    • The page is thin, duplicate, or low-quality. Requesting indexing won’t override Google’s quality filters.

    The tool works best as a diagnostic instrument, not a publishing workflow. If you’re hitting the request-indexing button for every post, you’re either publishing too much low-value content or your site has deeper crawl-budget problems that no amount of manual requests will fix.

    One Two Three Send covers SEO tools, traffic strategy, and operator workflows every week. Subscribe here to get the next breakdown in your inbox.

  • Reddit’s new Ads API opens self-serve targeting to solo operators

    Reddit’s new Ads API opens self-serve targeting to solo operators

    Reddit rolled out a full-featured Ads API in late May 2026, and most solo operators missed it. The platform had previously gated programmatic access behind agency partnerships and minimum monthly spends well into five figures. Now you can spin up campaigns, pull performance data, and automate bid adjustments with a free developer account and a credit card that clears the $5 daily minimum.

    If you’ve been running Reddit ads through the web dashboard or ignoring the platform entirely because the manual workflow didn’t scale, this changes the math.

    What the API actually unlocks

    The new endpoints cover campaign creation, audience targeting, creative upload, bid management, and reporting. You can now script campaign launches tied to content publish dates, auto-pause underperforming ad groups when cost-per-click crosses a threshold, or pull spend and conversion data into your own analytics stack without CSV exports.

    The targeting options mirror what’s available in the dashboard—subreddit lists, interest clusters, keyword targeting, and lookalike audiences based on pixel data—but you can now template and duplicate campaigns in bulk. If you’re testing ten subreddit combinations across three creative variants, that’s thirty manual setups in the UI versus a single script run.

    Rate limits sit at 600 requests per minute for most endpoints, which is generous for a solo operator or small team. Creative assets upload through a separate media endpoint that accepts PNG, JPG, and MP4 up to 200 MB. Video ads now support 16:9 and 4:5 aspect ratios, though square still outperforms in feed placement based on Reddit’s own case studies published in April.

    Where the workflow breaks down

    The API documentation assumes you’re comfortable with OAuth 2.0 flows and can parse JSON responses without a GUI. If you’ve never touched an API before, the learning curve is steeper than clicking through Ads Manager. Reddit provides Python and JavaScript SDKs, but they’re not as polished as Meta’s or Google’s—expect to write more error-handling logic yourself.

    Conversion tracking still requires Reddit’s pixel or the Conversions API, and setup is manual. You can’t provision pixels programmatically yet, so your first campaign still involves copying a JavaScript snippet into your site footer or wiring up server-side events. If you’re running a headless CMS or a static site, the server-side route is cleaner but requires endpoint configuration that isn’t trivial.

    The API also doesn’t surface some diagnostics that show up in the dashboard. If an ad gets rejected for policy violations, the error message in the API response is often a generic code without the specific flagged term. You’ll still need to log into the web UI to see what tripped the filter.

    Pricing and when this makes sense

    Reddit ads run on a second-price auction with a $5 daily minimum per campaign. CPCs vary wildly by subreddit—anywhere from $0.20 in broad interest groups to $4+ in finance or SaaS communities. The API doesn’t change the auction mechanics, but it does let you kill spend faster when a test flops.

    This is worth the setup time if you’re running more than two campaigns a month, testing multiple subreddit clusters, or pulling ad data into a consolidated dashboard alongside Google, Meta, or other channels. If you’re spending under $500/month total and running a single evergreen campaign, the manual workflow is still faster.

    For content-driven businesses publishing on a schedule—newsletters that promote each issue, course creators launching cohorts, or affiliates running seasonal pushes—the ability to automate campaign start dates and creative swaps cuts hours of repetitive work.

    One non-obvious trick

    Reddit’s audience expansion toggle is on by default when you create campaigns through the API, even if you specify exact subreddit targeting. This means Reddit will serve your ad outside your defined subreddit list if its algorithm thinks the user matches your intent. That’s fine for awareness plays, but it torches budgets if you’re targeting a niche community for a specific reason.

    The parameter is expansion_enabled in the campaign create request. Set it to false unless you’ve explicitly decided to let Reddit’s algorithm roam. The dashboard makes this a checkbox you have to actively enable; the API flips the default.

    If you want to test this without writing code, tools like Postman or Insomnia let you authenticate and send API requests through a GUI. Reddit’s OAuth flow is standard—register an app in your account settings, grab your client ID and secret, request a bearer token, and attach it to subsequent requests. The whole setup takes about fifteen minutes if you’ve done it with another platform before.

    Have you tried Reddit’s Ads API yet, or are you sticking with another platform for paid tests? Reply and let us know—we’re tracking which ad channels solo operators actually use in 2026, and we’ll share the numbers in a future issue. Subscribe here if you want that data when it drops.

  • Paid ads vs. organic SEO: the real break-even timeline

    Paid ads vs. organic SEO: the real break-even timeline

    Two operators I know launched similar content sites in Q3 2025. Same niche—B2B SaaS workflows. Same publishing cadence—two posts per week. Same monetisation model—affiliate revenue and a small paid community.

    One went all-in on Google Ads from day one. The other committed to pure SEO for six months, then layered in paid only after organic traffic hit 10,000 monthly visits.

    They compared notes in April 2026. The data surprised both of them.

    What the paid-first operator spent

    Operator A launched with a $1,500/month Google Ads budget, targeting bottom-of-funnel keywords around tool comparisons and buyer intent phrases. Cost per click averaged $2.80. Monthly traffic in month one: 520 visits. Conversion to email: 4.2%, or roughly 22 subscribers.

    By month six, the budget was still $1,500. Traffic had grown to 980 visits per month as ad copy and landing pages improved. Email conversion climbed to 6.1%. Total ad spend through six months: $9,000. Total subscribers acquired via paid: 312. Cost per subscriber: $28.85.

    Affiliate revenue during those six months: $1,840. The site was still $7,160 in the hole on traffic acquisition alone, before accounting for content production time or tooling costs.

    What the SEO-first operator saw

    Operator B published the same cadence but spent nothing on ads. Month one traffic: 14 visits, all from social shares and a few backlinks. Month three: 310 visits as Google started indexing comparison posts. Month six: 11,400 visits, driven by three posts that cracked page-one rankings for medium-competition keywords.

    Email conversion rate: 3.8%, slightly lower than paid because organic traffic skews top-of-funnel. Total subscribers by month six: 433. Cost per subscriber: $0 in media spend, though time cost was real—roughly 60 hours of keyword research, on-page optimisation, and link outreach spread across six months.

    Affiliate revenue during the same six months: $4,720, turning profitable in month five when one post started ranking for a high-intent buyer keyword.

    The real break-even point

    Operator A’s paid strategy didn’t break even on media spend until month eleven, when cumulative affiliate revenue finally overtook cumulative ad spend. By that point, the site had 640 email subscribers and was generating $890/month in predictable affiliate commissions. Paid traffic was stable and forecastable, but expensive to maintain.

    Operator B’s SEO play broke even on opportunity cost around month seven—the point where monthly affiliate revenue exceeded what the operator would have earned freelancing for the same 60 hours. Traffic continued compounding. By month eleven, the site was at 18,200 monthly visits with zero ongoing media cost.

    The gap widened from there. Operator B’s affiliate revenue hit $2,100/month by month twelve. Operator A’s hovered around $1,050, constrained by ad budget and CPCs that crept upward as competition entered the space.

    When paid makes sense anyway

    This isn’t an argument to never run ads. Operator A’s paid strategy delivered two things SEO couldn’t: speed and certainty. Subscribers showed up in week one, not month four. Conversion data came fast enough to iterate on messaging and offer positioning before building six months of content on a guess.

    Operator A also controlled the tap. Need 50 more email subscribers this week to hit a sponsor commitment? Increase the daily budget. SEO doesn’t let you do that.

    The break-even calculus shifts if you’re monetising with a higher-ticket offer. If each email subscriber is worth $80 in course revenue instead of $6 in affiliate commissions, a $28 cost per acquisition makes paid the faster path to cash flow.

    But for affiliate-driven content businesses with patient capital and time to write, the SEO curve still wins on total return. The sixth-month inflection point is real—if you can survive it.

    One thing to try this week: If you’re running paid traffic, model out what happens if you cut your budget in half and redirect that cash into content production or link outreach. Run both channels for 90 days and compare cost per conversion, not just cost per click. The answer will tell you which lever to pull harder.

    Hit reply if you’ve run this experiment yourself—I’m collecting more data points for a follow-up piece.